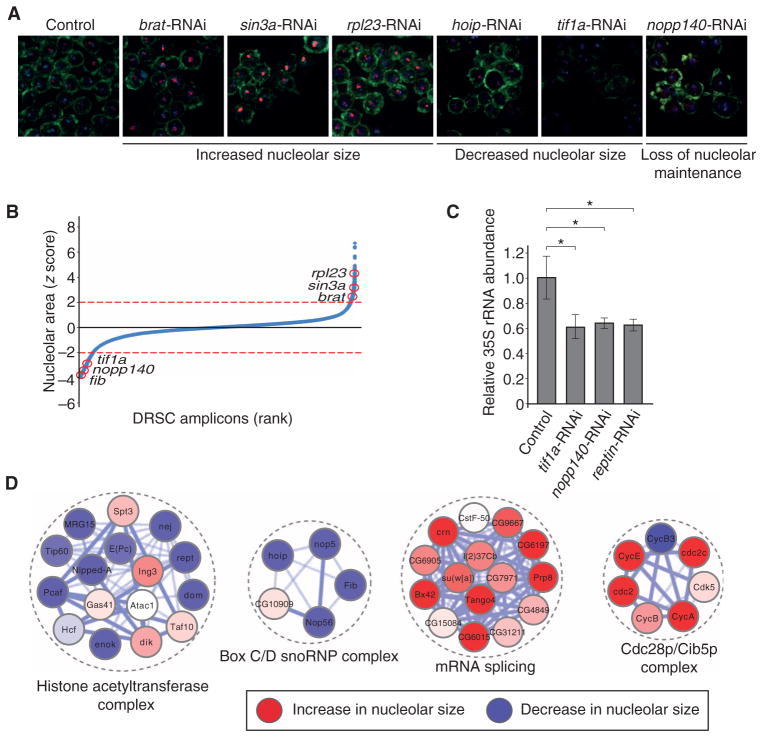
Fig. 3. A genome-wide RNAi screen for nucleolar size defects in Drosophila cell culture.
(A) Representative images of different nucleolar phenotypes upon RNAi-mediated loss of function. Images are representative of three or more independent biological replicates. (B) Z score–ordered rank plot of all screened Drosophila RNAi Screening Center (DRSC) amplicons. Red circles indicate the z score of the respective genes (red lines represent a z score of ±2 used for hit selection). (C) 35S pre-rRNA abundance is decreased upon RNAi targeting tif1a, nopp140, and pontin as measured by qRT-PCR. Bars represent the means ± SD of four independent biological replicates. *P < 0.05. (D) Examples of enriched molecular complexes regulating nucleolar size (red: increase in nucleolar size, blue: decrease in nucleolar size).

