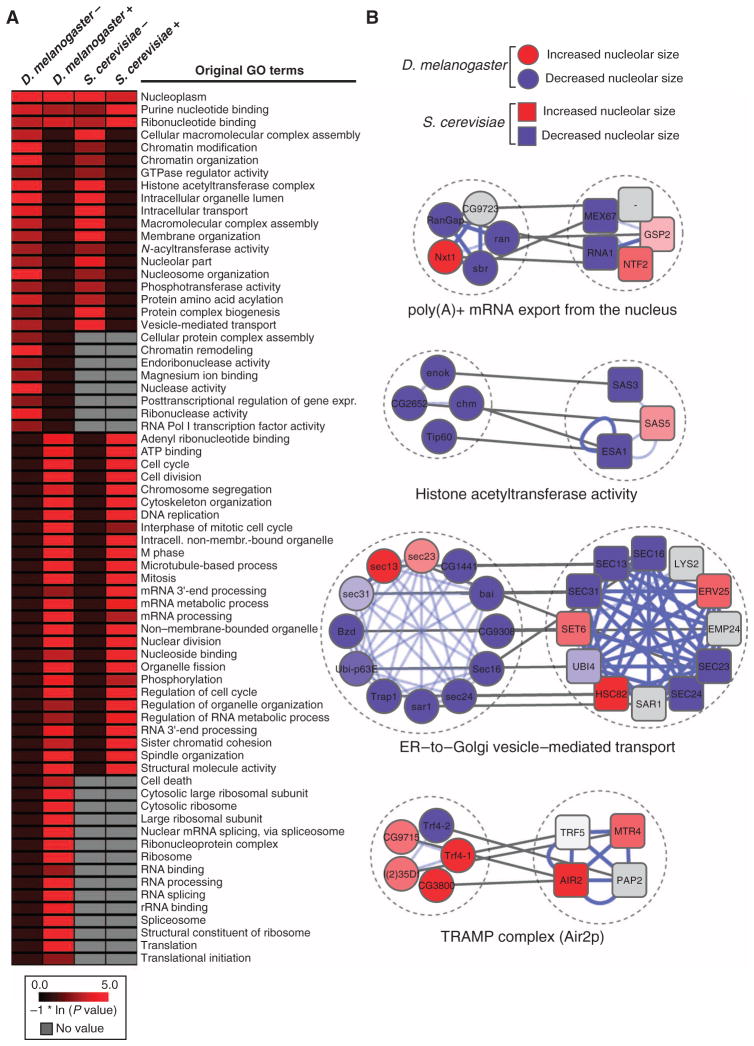
Fig. 4. Comparative analysis between the S. cerevisiae SGA and the D. melanogaster RNAi screens.
(A) Heatmap displaying the natural log–transformed P values for a selected set of GO terms [D. melanogaster, S. cerevisiae, decrease (−) or increase (+) in nucleolar size; a comprehensive heatmap displaying the results of the GO term analysis is given in fig. S6]. (B) Examples of evolutionarily conserved molecular complexes regulating nucleolar size in D. melanogaster and S. cerevisiae (red: increase in nucleolar size, blue: decrease in nucleolar size, gray: genes that have not been screened or for which no homolog exists in the respective species, white: no nucleolar size phenotype detected; blue lines denote PPIs, and gray lines connect homologous genes).

