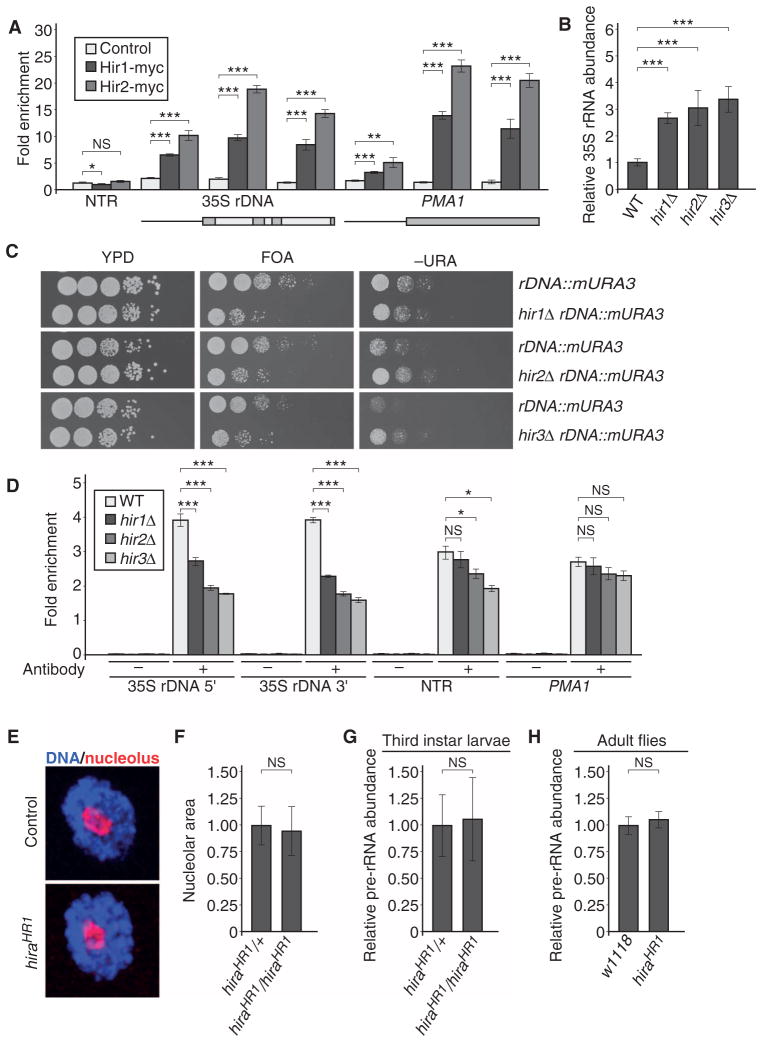
Fig. 6. The histone chaperone HIR complex regulates 35S rDNA transcription specifically in S. cerevisiae.
(A) The HIR complex is associated with the 35S rDNA region. ChIP qPCR analysis of myc-tagged Hir1 and Hir2 at the 35S rDNA region and the PMA1 control region, and a nontranscribed region (NTR) was performed with the indicated antibodies. Bars represent the means ± SD of five independent biological replicates. ***P < 0.001; **P < 0.01; *P < 0.05; NS, not significant. (B) Deletion of HIR complex members in S. cerevisiae results in increased 35S pre-rRNA abundance, as determined by qRT-PCR with specific oligonucleotides recognizing the 35S pre-rRNA. Values are normalized relative to the PMA1 control gene, and 35S pre-rRNA abundance for WT is set to 1. Bars represent the means ± SD of five independent biological replicates. ***P < 0.001. (C) Mutants of the HIR complex in S. cerevisiae show 35S rDNA silencing defects. Images are representative of three independent biological replicates. (D) HIR complex mutants show reduced histone H3 binding at the 35S rDNA region. ChIP using H3-specific antibodies followed by qPCR to determine the abundance of H3 at different loci in WT, hir1Δ, hir2Δ, or hir3Δ strains. Immunoprecipitation values were normalized to input values. Bars represent the means ± SD of four independent biological replicates. ***P < 0.001; *P < 0.05. (E) Representative images of D. melanogaster third instar larval salivary gland nucleoli of control and hira null (HR1) animals. Images are representative of three independent biological replicates. (F) Quantification of nucleolar size in control (hiraHR1/+) and hira null third instar larval salivary nuclei. Bars represent the means ± SD of three independent biological replicates. (G) qRT-PCR experiment assaying the 35S pre-rRNA abundance in control and hira null third instar larvae. Bars represent the means ± SD of three independent biological replicates. (H) qRT-PCR experiment in control (w1118) and hira null adult male flies assaying the 35S pre-rRNA abundance. Bars represent the means ± SD of three independent biological replicates.

