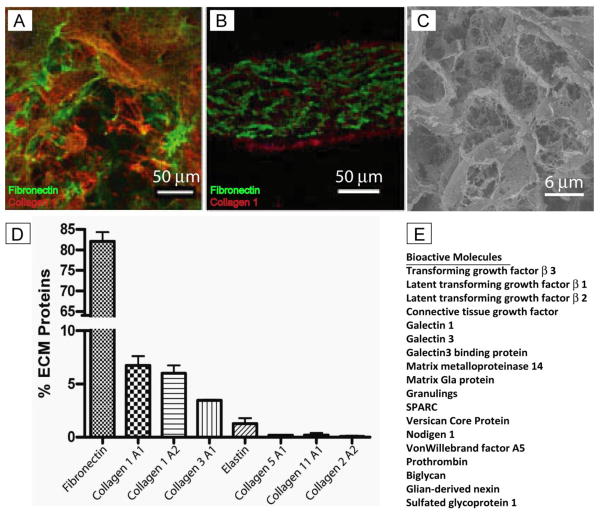
Figure 2.
A, Surface staining of CF-ECM scaffold (scale bar = 50 μm). B, Cross section of CF-ECM scaffold, note the thickness of approximately 150 μm, Fibronectin (green), Collagen type I (red), DAPI (blue) (scale bar = 50 μm). C, Scanning electron micrograph of CF-ECM surface (scale bar = 40 μm). Note the absence of DAPI staining in the scaffolds, indicating the absence of residual cells. D) Protein composition of the CF-ECM scaffold. Note the high fibronectin content. E) Bioactive molecules identified by mass spectrometry

