
Figure 1.
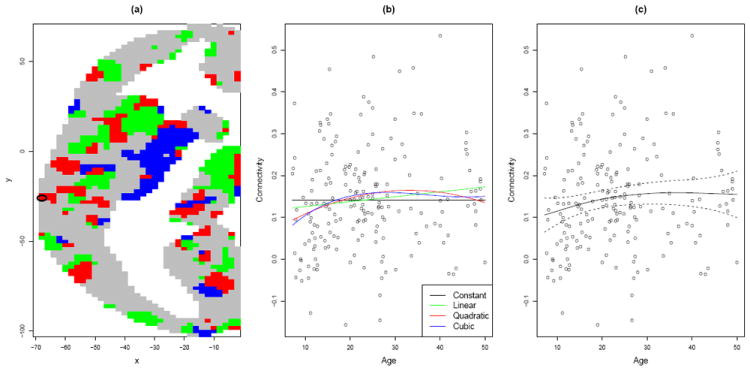
(a) Voxels in an axial slice of the brain—the z = 24 plane in MNI coordinates—are colored grey, green, red, or blue, depending on whether the dependence of homotopic functional connectivity on age is best described by a constant, linear, quadratic or cubic function. (White space represents areas outside the grey matter portion of the brain.) The horizontal and vertical axis labels refer to x- and y-coordinates in MNI space. (b) Fitted polynomial functions for the voxel circled in (a). (c) A penalized spline fit with approximate 95% Bayesian confidence interval.