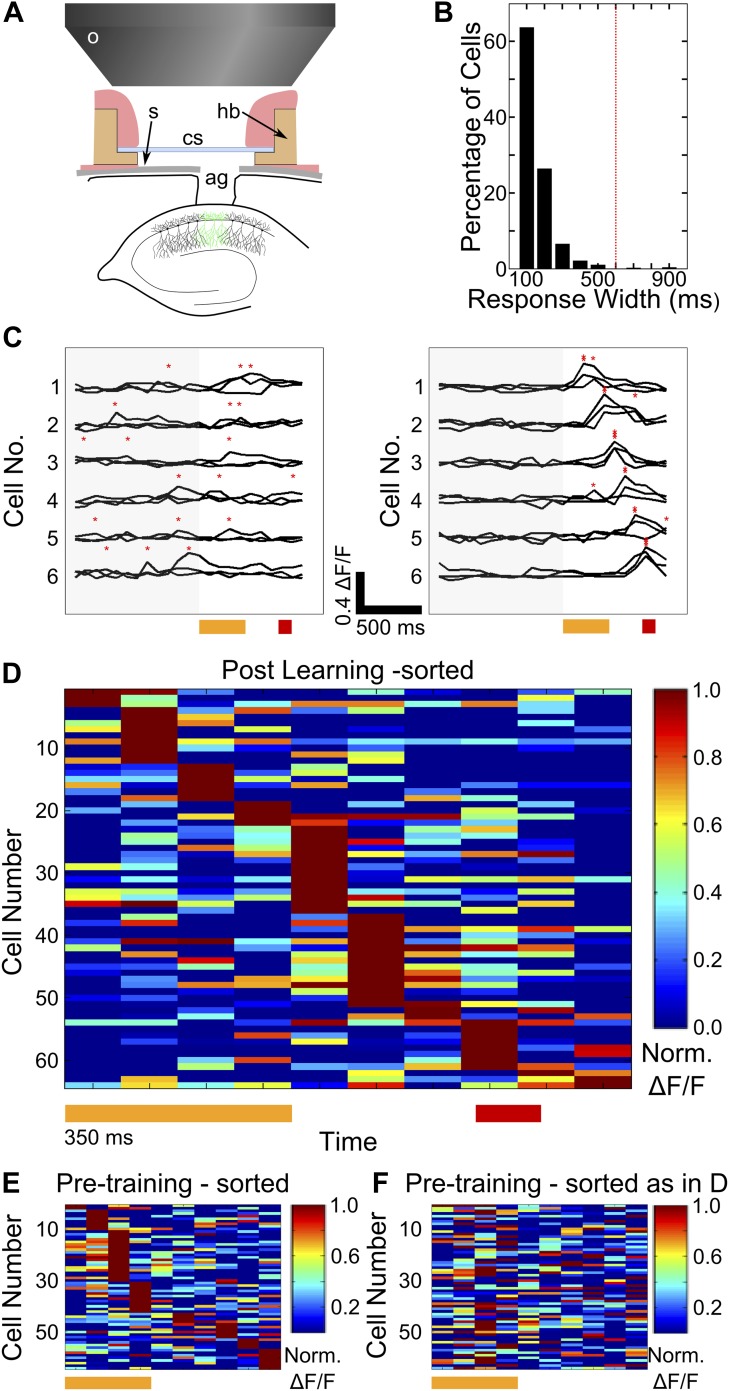
Figure 2. Two-photon imaging of calcium-responses in area CA1 neurons from awake mice.
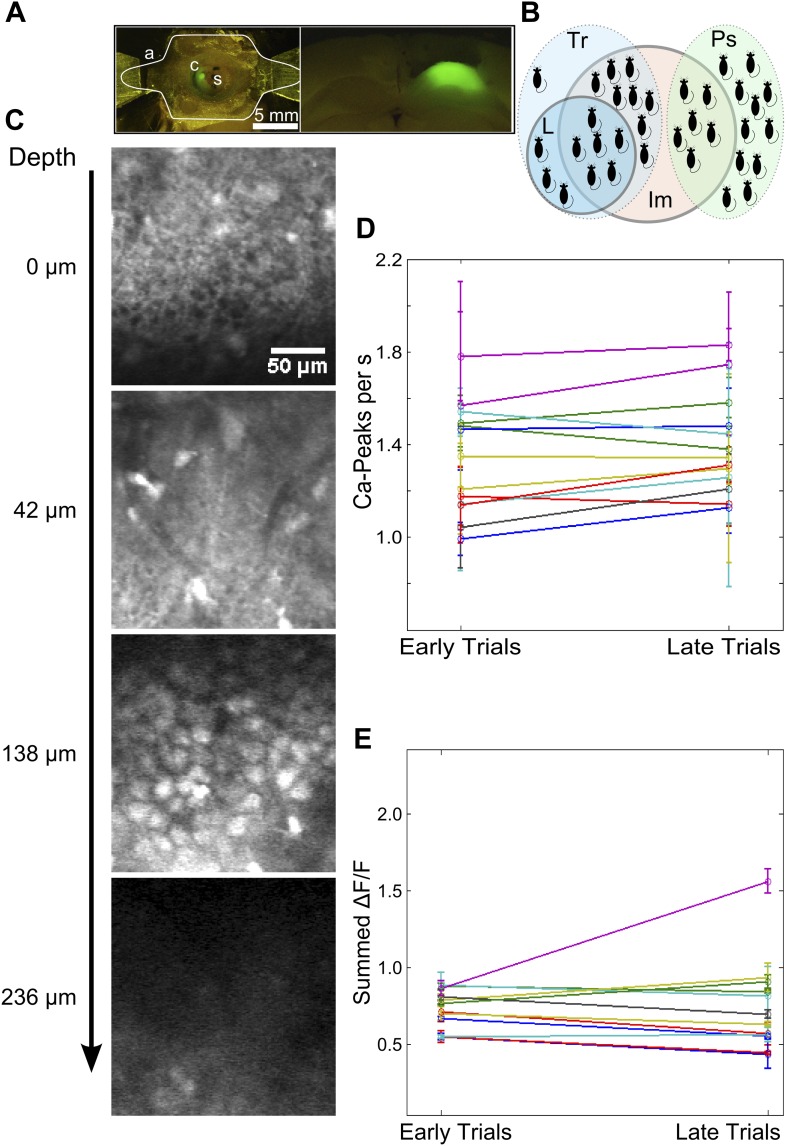
(A) Schematic of the imaging preparation. o–objective lens, s–skull, cs–cover slip, hb–head bar, ag–agarose. (B) Histogram of neuron response widths in ms, calculated as the time for which a given neuron’s trial-averaged, ΔF/F trace remains above 50% of the peak value. The red, dotted line indicates a response width of 600 ms, which is the time of interest between tone-onset and puff-onset. (C) Area CA1 cell responses show sequentially timed activity peaks after learning. Calcium response (ΔF/F) traces for six exemplar neurons from a single mouse, for sets of three trials before (panel on the left), and after (panel on the right) task learning. Neurons have been sorted as per the timing of the peak in the averaged trace. The yellow and red bars at the bottom represent the times of delivery of tone and puff respectively. The gray shading to the left covers the period of spontaneous activity prior to the onset of the tone. The red asterisks indicate the peak in each individual trace. Scale bars indicate 0.4 ΔF/F and 500 ms along the time axis. (D) Area CA1 cell activity peaks tile the entire CS-on to US-off interval. Area CA1 calcium response traces from an example dataset, sorted by the peak times of the responses. Each response trace has been averaged over all trials following the learning trial (Figure 1G), and has been normalized to the peak ΔF/F response value for each neuron. The yellow and red bars below indicate times of delivery of tone and air-puff respectively. 50% of the neurons from the field of view, with the most reliably timed responses have been shown. This is to make this plot comparable to the ones from subsequent analyses, where neurons have been similarly chosen. (E and F) Cell activity peak timings change during learning. In E, pseudo-colored ΔF/F traces for the period of interest during and after tone delivery, are plotted using data acquired during the pre-training session, where tones without air-puff were delivered. Cells have been sorted as per the timings of peaks in pre-training session data. The yellow bar at the bottom indicates time of delivery of tone (350 ms). In F, the same averaged activity traces as in E have been re-ordered according to each cell’s activity peak timing after learning has occurred, as shown in (D) Plotted in Figure 2—figure supplement 1, are panels depicting the surgical preparation, the numbers of mice from each treatment group, images of dye-loaded tissue taken at multiple depths and basic data quality control analyses.


