. 2014 Mar 25;3:e01982. doi: 10.7554/eLife.01982

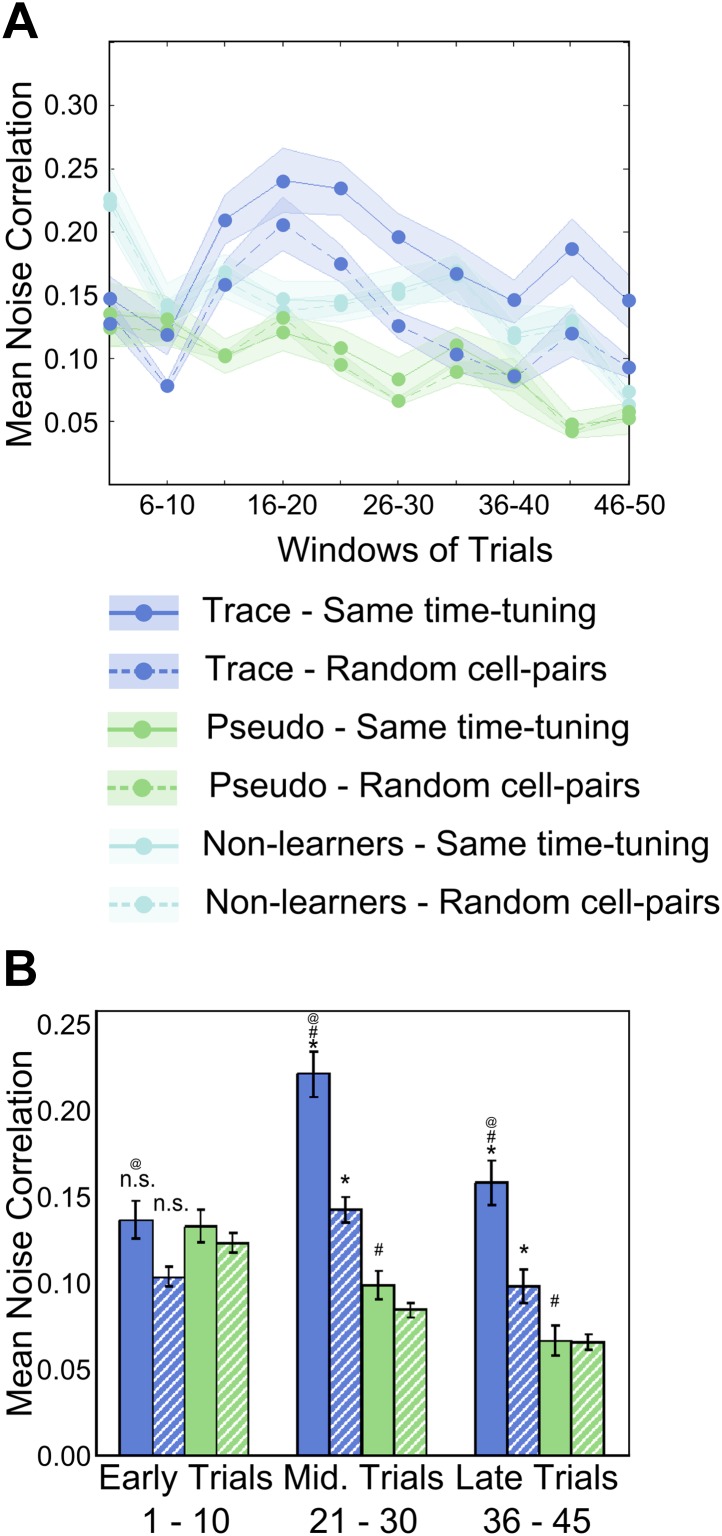
Figure 4. Area CA1 cell noise-correlations increase transiently during training.

(A) Average neuron-pair noise correlations plotted as a function of training trials for task learner mice (blue curves), pseudo-conditioned mice (green curves) and non-learners (cyan curves). Solid lines represent average noise correlations between neurons that share similar time tuning (same PT), whereas dashed lines indicate average noise correlations between random neuron pairs. Pair-wise noise correlations have been determined from spontaneous activity traces over five trial windows. Shaded regions indicate SEM. (B) Summary statistics comparing average noise correlations across early (trials 1–10), middle (trials 21–30) and late (trials 36–45) stages of training, between task learner mice (blue bars) and pseudo-conditioned mice (green bars). Solid bars represent average noise correlations between neurons that share similar time tuning (same PT) whereas hatched bars represent average noise correlations between random neuron pairs. Error bars represent SEM. (* indicates within condition [same time-tuning v/s random cell-pairs], # indicates across conditions [trace learners v/s pseudo-conditioned] and @ indicates comparisons across stages of learning [early v/s middle v/s late], p<0.01; n.s. indicates not significant). Figure 4—figure supplement 1A depicts the point in the session at which behavioral CR rates, CA1 cell timing reliability and spontaneous activity correlations reach their peaks, on an individual mouse basis. It also presents further characterization of the changes in NC during learning.

DOI: http://dx.doi.org/10.7554/eLife.01982.012

Figure 4.

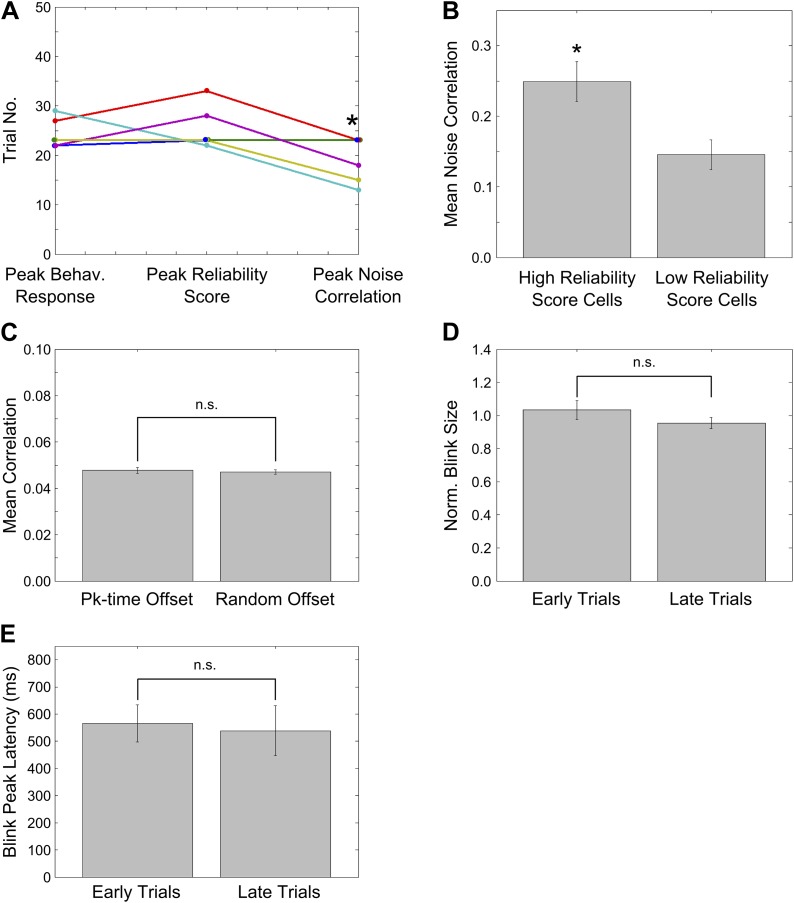
Figure 4—figure supplement 1. Peaks of CR rate curve, CA1 activity timing reliability and NC; characterization of NC changes during learning.

Figure 4—figure supplement 1.

(A) Plots for individual mice, showing the trial number (or middle of trial-bin) of the training session when the learning trials, peaks in mean reliability scores of time-locked activity and mean spontaneous activity correlations occurred. For mean reliability scores and noise-correlations, the centers of the peak trial-bins have been plotted. Circles of a given color indicate values for a given mouse that learned the association. * indicates p<0.05. (B) Noise correlations are higher for neurons with high activity timing reliability scores. Neurons were classified into two groups based on their activity timing reliability scores. The spontaneous activity correlations were calculated for pairs of cells sharing the same activity peak timing. Plotted here are the mean spontaneous activity correlations for high and low reliability score groups. * indicates p=0.004. (C) Stimulus period activity sequences are not detectable in spontaneous activity. Spontaneous period activity traces for each neuron were given time offsets equal to the neurons peak timing in the stimulus period sequence. Thereafter, correlation coefficients were calculated for all neuron pairs. If similar sequences were re-capitulated during spontaneous activity, these correlations would be high. As a control, traces were given offsets randomly chosen from the existing peak timings and the same calculations carried out. The correlations of peak time offset activity traces were not significantly different from those for randomly offset traces (n.s.–p=0.71). (D) Mouse blink sizes remain stable over the training session. Blink size was estimated by calculating the area under the eyelid position curve during the tone-onset to puff-onset period for significant blink trials. The mean blink sizes before and after trial 25 of the training session were calculated across mice and compared and found not to be significantly different (n.s.–p=0.62). (E) Mouse blink peak latencies remain stable through the session. The latencies of the peak of the eyelid position trace from the time of tone onset were measured for significant blink trials. The mean blink latencies before and after trial 25 of the training session were calculated across mice and compared and found not to be significantly different (n.s.–p=0.80).