Figure 4.
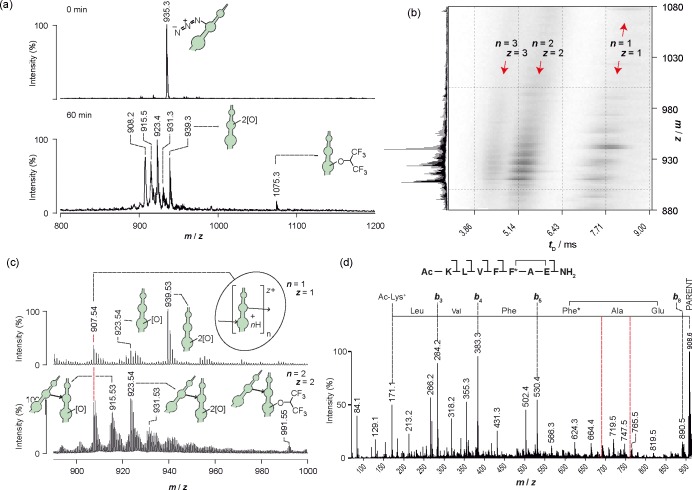
(a) Photolysis of aggregated Aβ16–22-PA20 (254 nm), monitored by LC–MS. Assigned products are depicted in cartoon form. (b) IMS–MS 3D-driftscope plot (m/z versus drift time, tD, versus square-root-scale intensity) showing 2D separation of photolysis products, where n is the number of monomers from which the species is composed and z is the ion charge (a full mass spectrum is given on the left vertical axis). (c) Mass spectra from vertical slices of the IMS–MS plot (i.e., 2D mass spectra for m/z at selected narrow range of tD), featuring singly charged monomers (n = z = 1) and doubly charged dimers (n = z = 2). Assignments are depicted in cartoon form. (d) Sequencing of cyclized Aβ16–22-PA20 from MS/MS data. Red dotted lines are used to highlight the absence of b6 and b7 and hence the intramolecular cross-link position.

