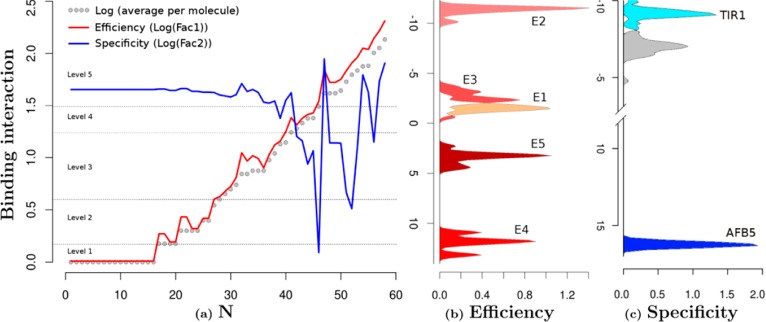
Figure 5.

Structure and functional characterization of auxin-like molecules toward their binding with TIR1 and AFB5. (a) Ligand screening data for binding at both receptors (N is the compound reference number in Supplementary Table S2). The black data points are the log values of the mean of the binding per compound for both TIR1 and AFB5 (binding average). The red line represents the first orthogonal factor that is associated with general binding Efficiency of each compound (87.29% of variance). The blue line is the second orthogonal factor, which we associate with binding Specificity (12.71% of variance). Compounds are divided by the analysis into five groups of binding Efficiency along the curve. (b) Quantum chemical classification to predict the membership of the ligands based on their binding Efficiency (E1–E5) and (c) binding specificity, which distinguishes the chemical nature of the binding to TIR1 and AFB5. The statistical membership of both Efficiency and Specificity using quantum chemical variables was predicted with 100% of efficiency. The density of molecules predicted per group is projected on the first lineal discriminant equation for both cases.
