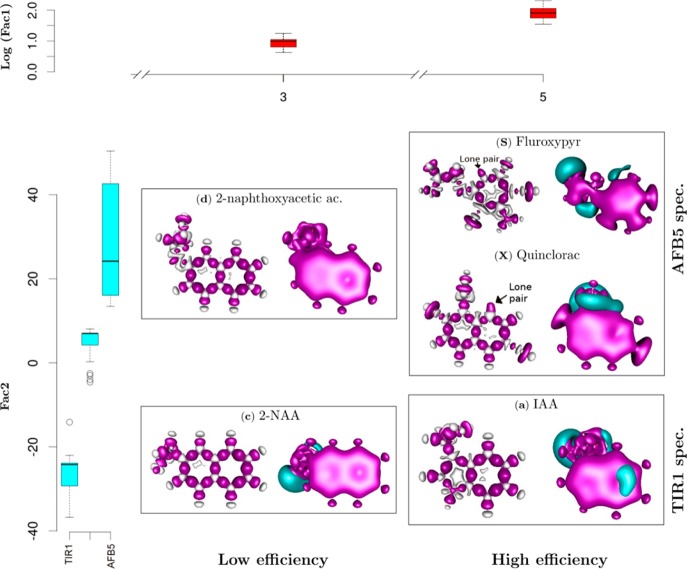
Figure 7.
Discrimination of auxin-like molecules. Functional dependences were analyzed between the quantum chemical variables of each ligand and binding with TIR1 and AFB5. Box plots show statistical analyses of molecular groupings (Figure 6), relating the feedback between molecular structure and binding Efficiency (log Factor 1 abbreviated to Fac1) and binding Specificity (Fac2). Compounds are organized at two levels of efficiency, low (E3) and high (E5) determined by Fac1, and two levels of specificity, TIR1 and AFB5 (Fac2). Quantum solutions for representative molecules are illustrated. At the right of each panel the blue color represents negative potential at −0.025 atomic units [au], and red the quadrupole moment (0.001 au). These areas are highly likely to contribute hydrogen bond and van der Waals interactions, respectively. The skeletal molecular structure at the left of each panel represents the deformation of the electron density forming intramolecular covalent bonds. The red areas are the positive deformation of the electron density (−0.01 au) or covalent bonds, while the gray areas are the negative deformation (−0.02 au) of the electron density or donor areas. The analysis indicates lone pair electrons on Fluroxypyr and Quinclorac molecules, indicating regions that play a determining role in intermolecular forces.

