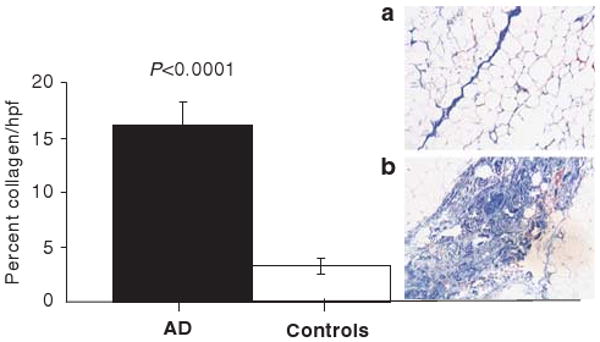
Figure 2.

Percent collagen per high power field in women with AD (black bar) and control women (open bar). Inset shows representative trichrome stained fat samples (40 ×) from one control subject (a) and one subject with AD (b). The dark blue-stained septum consisting primarily of collagen that stains blue after trichrome staining in (a) is thin and juxtaposed by fat cells; small blood vessels containing red blood cells can also be seen. In (b), fat cells are found on either side of a blue-stained septum that is much wider and more complex than that seen in (a). P-value refers to between group analyses.
