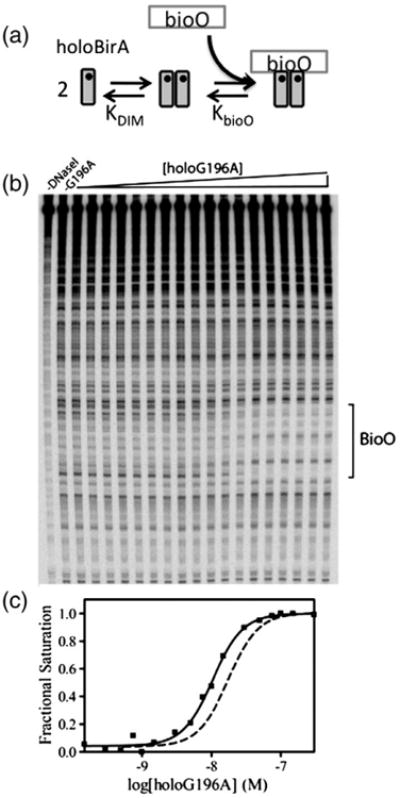
Fig. 3.

(a) Two-step assembly of holoBirA on bioO. (b) The DNase I footprint titration of bioO with BirA G196A. (c) The binding isotherm obtained from quantitation of the bioO band intensities. The continuous line represents the best-fit curve obtained from nonlinear least squares analysis of the data using Eq. (3). The isotherm obtained with wild-type BirA is shown for comparison (broken line).
