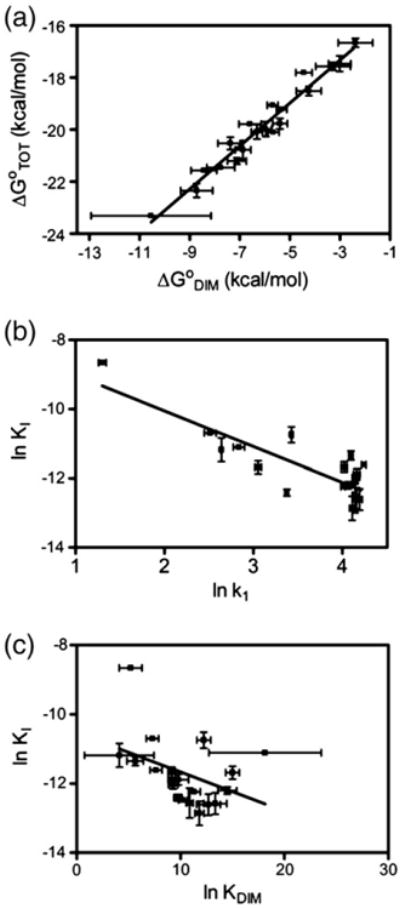
Fig. 7.

Relationship of holoBirA protein interactions to repression complex assembly and the holoBirA switch. Correlation analysis for (a) ΔG°TOT versus ΔG°DIM (r2 = 0.9556), (b) lnKI versus lnk1 (r2 = 0.7190), and (c) lnKI versus lnKDIM (r2 = 0.1702). The error bars for lnKI and lnKDIM are the standard errors from at least two independent measurements of KI and KDIM, and those in lnk1 were obtained from the analysis of kinetic data as described by Adikaram and Beckett [18].
