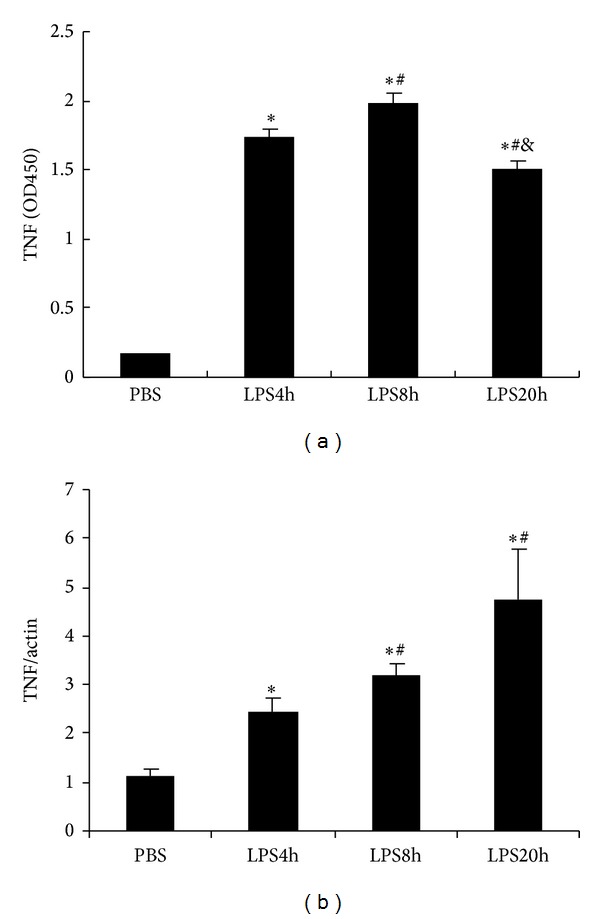
Figure 1.

Kinetics of TNF protein and mRNA expression in RAW264.7 cells stimulated with 100 ng/mL LPS. (a) TNF content in the supernatant was determined by ELISA; data are shown as OD450; (b) TNF mRNA expression level was determined by using real-time PCR. β-Actin was used as a control gene. The data shown are representative of three independent experiments. All values are expressed as mean ± SD (n = 3). *P < 0.05 compared with PBS, # P < 0.05 compared with LPS 4 h, and & P < 0.05 compared with LPS 8 h.
