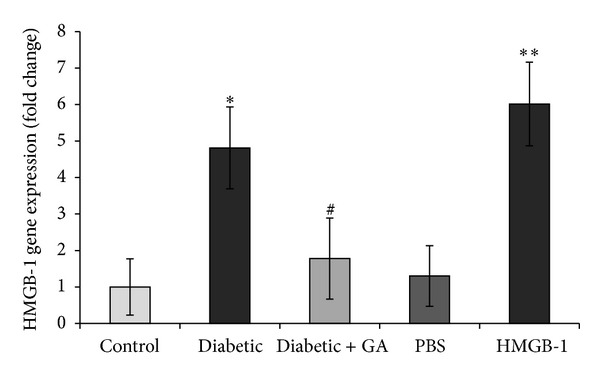
Figure 3.

Gene expression of high-mobility group box-1 (HMGB1) in the retinas was quantified by RT-PCR using a primer given in the Materials and Methods section and was adjusted to the mRNA level of β-actin in each sample. Each measurement was performed at least 3 times. Results are expressed as mean ± SD of at least 6 rats in each group. GA: glycyrrhizic acid; PBS: phosphate buffer saline *P < 0.05 compared with nondiabetic controlled rats. **P < 0.05 compared with PBS. # P < 0.05 compared with diabetic rats.
