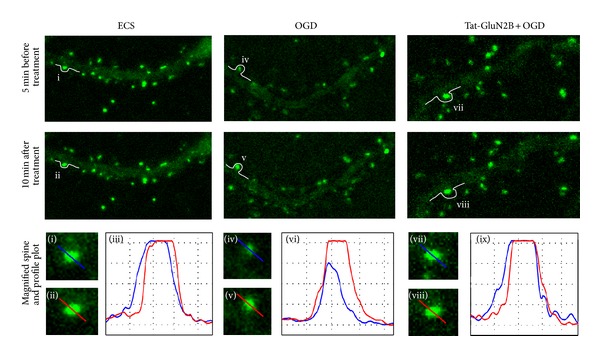
Figure 6.

The expression of NMDAR at spine was induced by OGD 2 min treatment and suppressed by Tat-GluN2B incubation. SEP-GluN1 transfected neurons were incubated with Tat-GluN2B for 15 min or not. Subsequently, imaging was performed on 5 min before (first row) and 10 min after (second row) ECS (as control) or OGD 2 min treatment. Magnified images were corresponding to the spines denoted by lowercase Roman numerals ((i), (ii), (iv), (v), (vii), and (viii)). Profile plots were corresponding to the blue and red lines in their left two magnified images ((iii), (vi), and (ix)).
