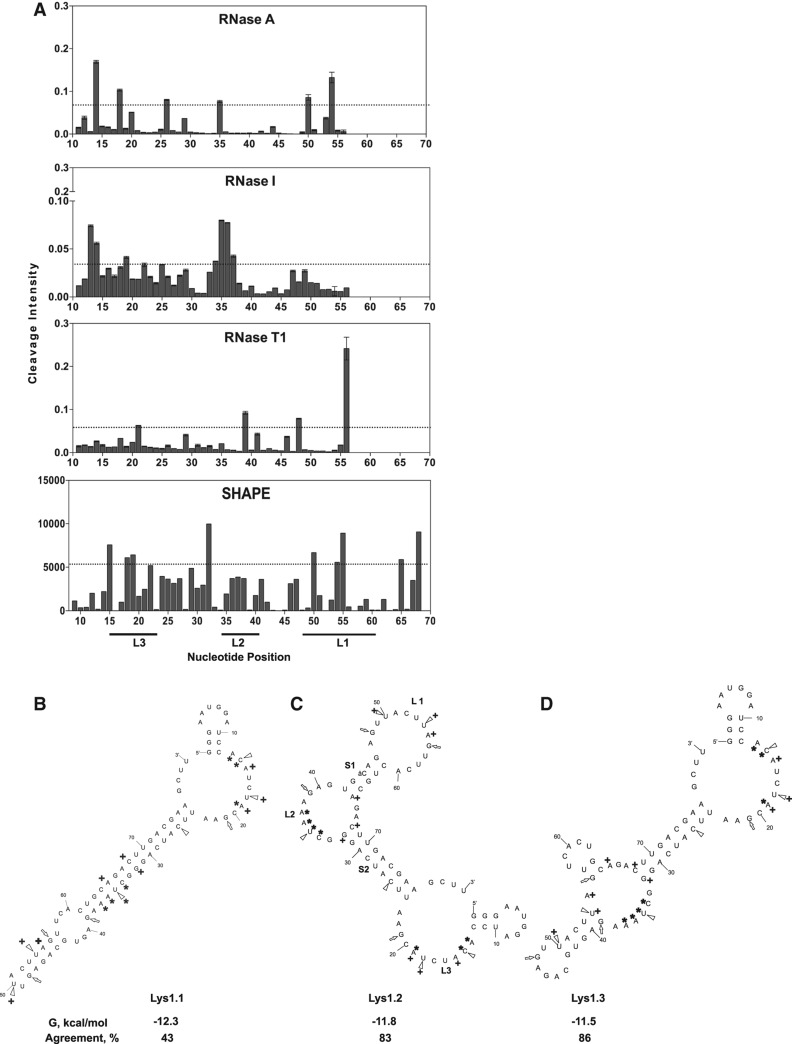
FIGURE 1.
Enzymatic and chemical footprinting-based determination of the correct Lys1 secondary structure. (A) Enzymatic (RNase A, RNase I, and RNase T1) cleavage and SHAPE modification of Lys1. Dotted horizontal bars represent two standard deviations from the mean cleavage intensity. Nucleotides whose intensity lies above the bar denote cleavage hits. The M-fold predicted secondary structures of lowest energy are shown. (B) Lys1.1 with M-fold predicted ΔG = −12.3 kcal/mol and percent agreement with footprinting = 43; (C) Lys1.2 with ΔG = −11.8 kcal/mol and percent agreement = 83; and (D) Lys1.3 with ΔG = −11.5 kcal/mol and percent agreement = 86. For each predicted secondary structure, open triangles indicate RNase A cleavage sites, open arrowheads indicate RNase T1 cleavage sites, and asterisks indicate RNase I cleavage sites. Nucleotides that readily react with NMIA (SHAPE reagent), indicating flexible and single-stranded nucleotides, are marked with a crosshair.

