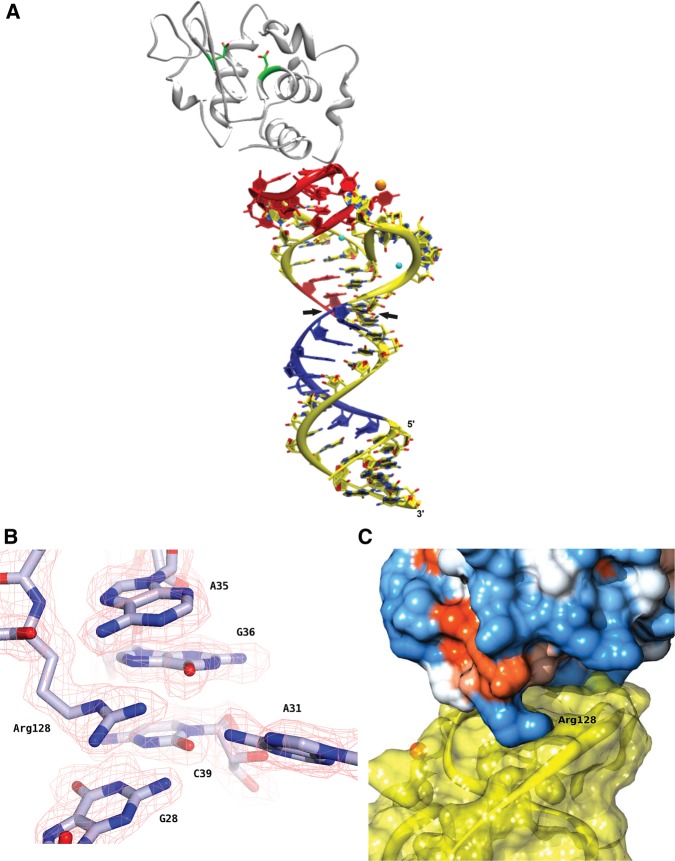
FIGURE 5.
Crystal structure of the Lys1.2minE–lysozyme complex. (A) Ribbon diagram with Lys1.2minE shown in yellow (with the regions of protection and deprotection observed by hydroxyl radical footprinting shown in red and blue, respectively), lysozyme backbone shown in gray with the side chains of catalytic residues Glu35 and Asp52 colored by atom type; (Na+) orange; (Mg2+ ) cyan. Black arrowheads indicate where stem has been trimmed for Lys1.2minF construct. (B) The Lys1.2minE structure superimposed onto the simulated annealing omit electron density map contoured at 1 σ. (C) Lys1.2minE binds to a basic patch on the surface of lysozyme, as observed by the electrostatic potential surface map of hen egg white lysozyme. Arg128 anchors the inside loop of minE, making several important contacts with neighboring nucleotides and water molecules.

