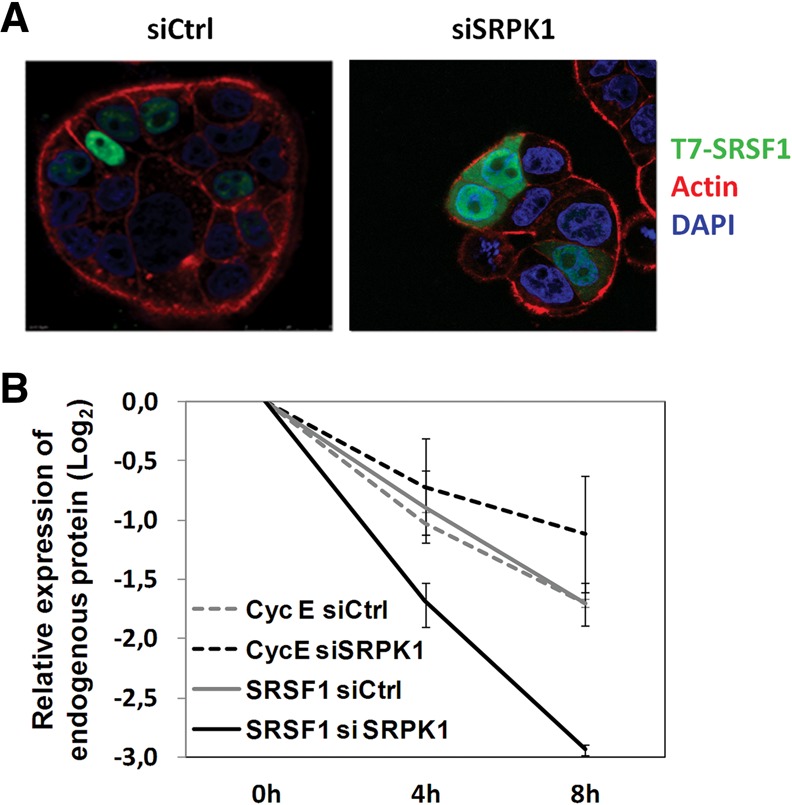
FIGURE 6.

Effect of SRPK1 depletion on SRSF1 subcellular localization and proteolytic degradation. (A) HT29 cells were transfected with the indicated siRNAs, cotransfected with T7-tagged SRSF1 24 h later, and analyzed by confocal immunofluorescence microscopy 20 h later. Shown are overlay images from cell staining for SRSF1 (green), actin (red), and DAPI (blue). Note the increased cytoplasmic staining of SRSF1 after depletion of SRPK1. (B) HT29 cells were transfected with the indicated siRNAs for 48 h and then treated with 500 μg/mL cycloheximide for the indicated periods. A graphical display of endogenous SRSF1 and CyclinE protein levels obtained by densitometry of Western blots bands is shown. Note the faster decay in SRSF1 protein levels in SRPK1-depleted (solid black line) compared to control cells (solid gray line), whereas Cyclin E levels (dashed lines) did not differ under the same conditions.
