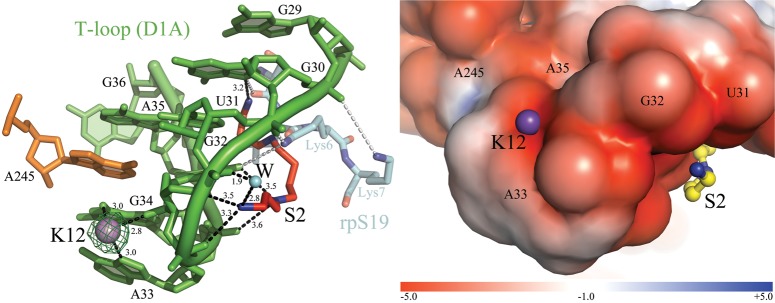
FIGURE 4.

K12 and S2 bind the T-loop. (Left) The ion-binding sites and the intron residues are colored as described in Figure 2. Inner-sphere coordination bonds are shown as black dashed lines for K12 and S2 and the corresponding distances are indicated in angstroms. Anomalous difference Fourier electron density map at the K12 site is shown as a green mesh at 6.0 σ for Tl+ (PDB id. 4E8Q). The N-terminal polypeptide of ribosomal protein S19 (rpS19) is shown in semitransparent cyan sticks (PDB id. 1J5E). Gray dashed lines indicate contacts between the amino acids of rpS19 (Ser4-Lys6-Lys7) and nucleobases of 16S rRNA analogous to the intron T-loop (C1314-U1315-G1316, which correspond to G30-U31-G32, respectively). The 16S rRNA residues are not shown for clarity, but they superpose precisely over the intron T-loop residues (RMSD = 1.4 Å). (Right) Electrostatic surface potential around K12 and S2. The color scale is indicated at the bottom in units of kT/e.
