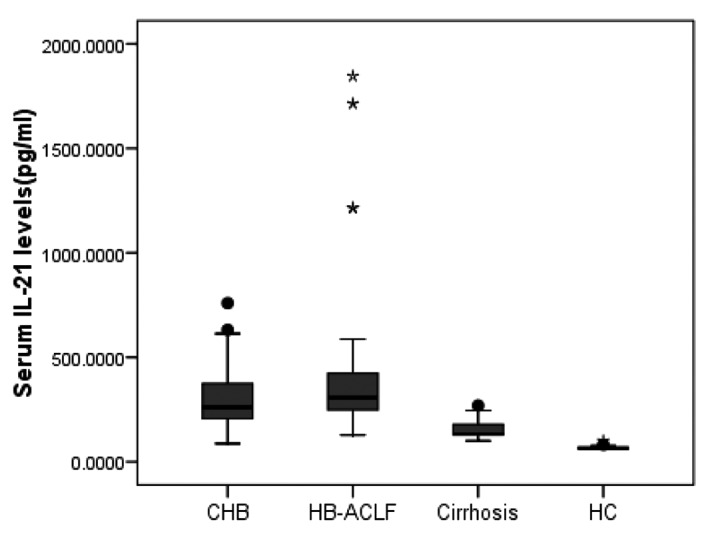
Figure 1.

Comparison of serum IL-21 concentrations in the four groups. Horizontal bars indicate the median values in each group. P-values indicate the significance of interclass comparisons using one-way analysis of variance. Corrected P-values were calculated by Bonferroni correction for multiple comparisons when the uncorrected P-value was <0.05. P=0.04, CHB vs. HB-ACLF; P=0.033, CHB vs. cirrhosis; P=0.003, CHB vs. HC; P=0.000, HB-ACLF vs. cirrhosis; P=0.000, HB-ACLF vs. HC ; P=0.82, cirrhosis vs. HC. CHB, chronic hepatitis B; HB-ACLF, hepatitis B-related acute-on-chronic liver failure; HC, healthy controls; IL-21, interleukin-21.
