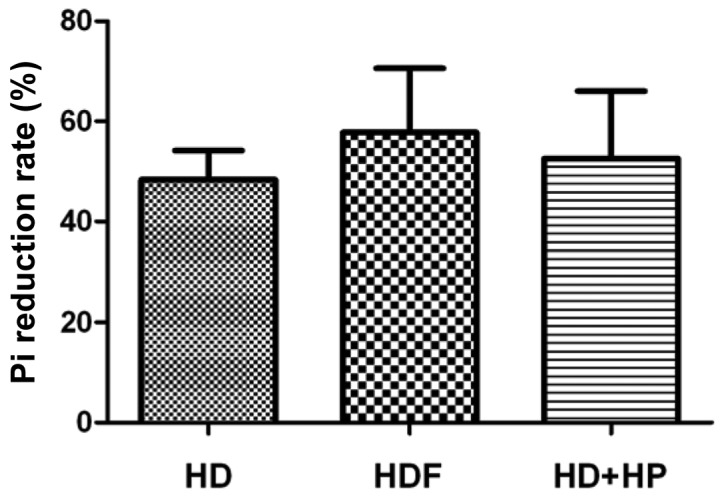
Figure 3.

Pi reduction rate in the three groups. There was no statistical difference observed between the groups regarding the serum Pi reduction rate, P>0.05 (means ± standard deviation). Pi, phosphorus; HD, hemodialysis; HDF, hemodiafiltration; HD+HP, hemodialysis and hemoperfusion.
