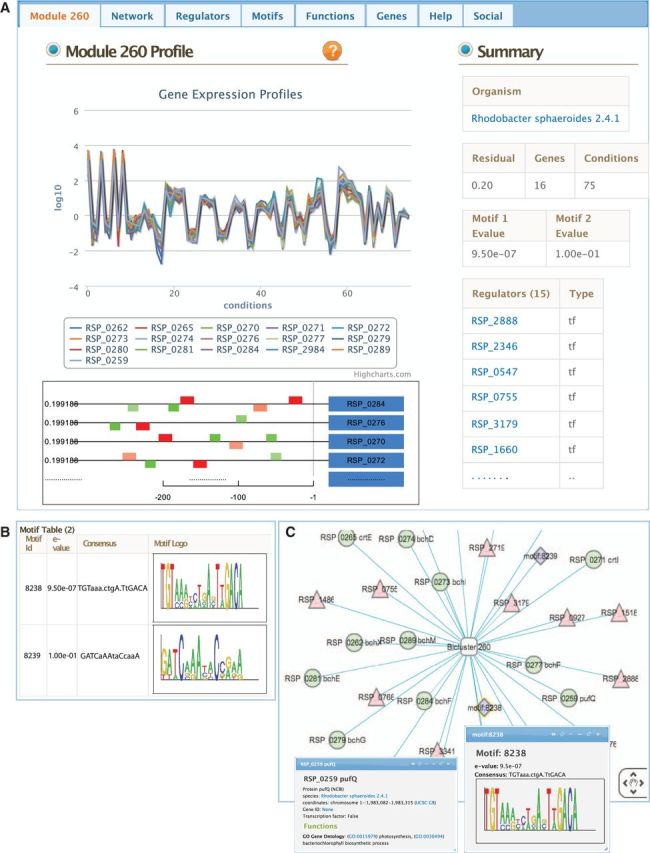
Figure 2.

An example module page. (A) The landing page for each module presents a summary view of the module, including an interactive plot of gene-expression profiles across conditions, motif locations upstream of the member genes and summary statistics. Tabs located on top of the page provide access to other visualization tools. (B) The motif table shows motif logos for de novo identified upstream regulatory motifs and E-value statistics. For selected organisms, a link to analyze the motifs using RegPredict is provided. (C) Interactive network visualization is created by using Cytoscape Web. An edge connects the module and each of its gene members, motifs and regulators. Clicking on a node opens up overlay window with detailed information.
