
Figure 3.
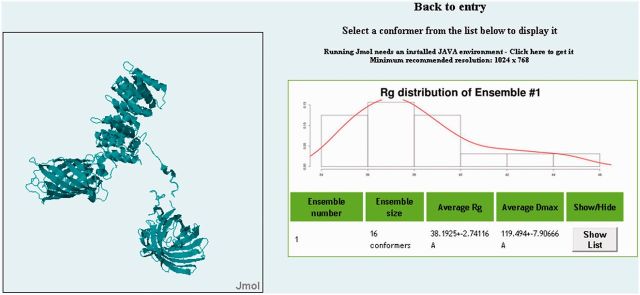
Jmol applet and list of conformers. Entries in pE-DB may have multiple ensembles, which may fit equally well the underlying experimental data. By navigating to the Jmol applet screen, the user can view the Rg distribution of each ensemble, the number of conformers and the average values for the Rg and the maximal distance (Dmax). By clicking on the ‘Show/Hide’ button, a list of the conformers appears, featuring Rg and Dmax values and a Jmol button. Clicking on the Jmol button, every single conformer can be selected to be visualized by a fully customizable Jmol applet.