
Figure 1.
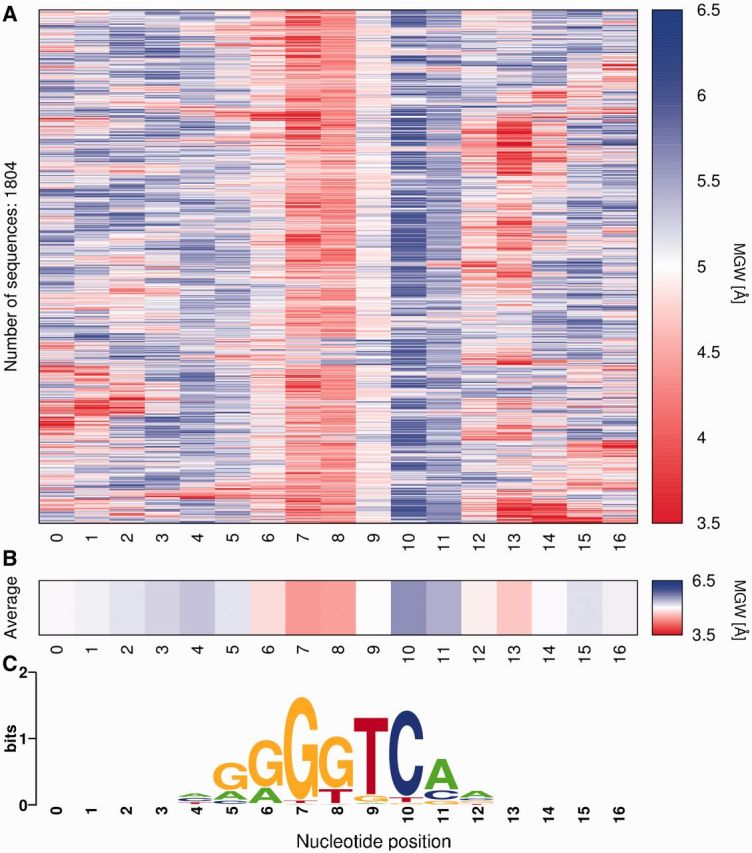
Example TFBSshape analysis of DNA shape preferences for an Hnf4a TF dataset from UniPROBE. (A) Heat map showing predicted MGW profiles for individual sequences, clustered based on EDs of MGW profiles, and (B) average heat map for all sequences. The colour code for both heat maps uses red for narrow MGW, blue for wide MGW and white for intermediate values. (C) PWM calculated using all analysed TFBS sequences, aligned with DNA shape heat maps as nucleotide sequence reference.