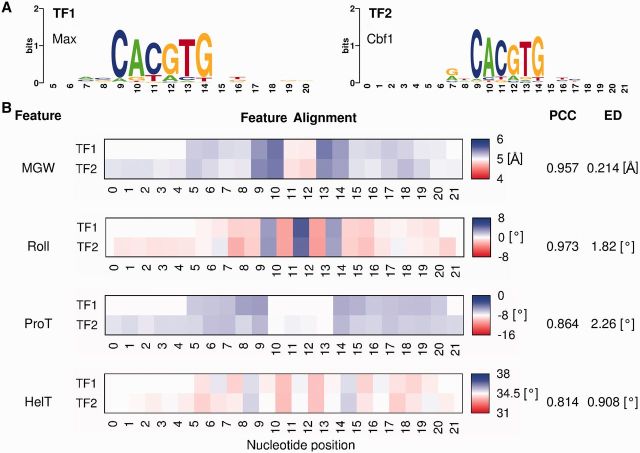
Figure 2.
Example TFBSshape comparison of DNA shape preferences of two TF datasets from UniPROBE for the homologous TFs Max from mouse and Cbf1 from yeast. (A) PWMs calculated for Max and Cbf1 using all analysed TFBS sequences, with nucleotide positions numbered according to the user-determined alignment. (B) Using the chosen alignment, average heat maps for the four DNA shape features MGW, Roll, ProT and HelT are shown for Max (TF1) and Cbf1 (TF2). These shape profiles were quantitatively compared using PCC and ED.

