
Figure 5.
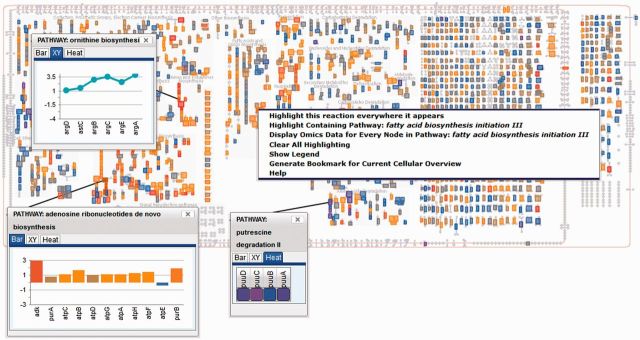
The Cellular Omics Viewer allows the user to paint omics data over the cellular Overview. New functionality enables the display of per-node omics data in a pop-up window as a column chart, an x-y plot or a heat map. The pop-ups can also be generated to show all the data for a given pathway. This figure also shows the pop-up that appears on right-clicking a reaction.