
Figure 3.
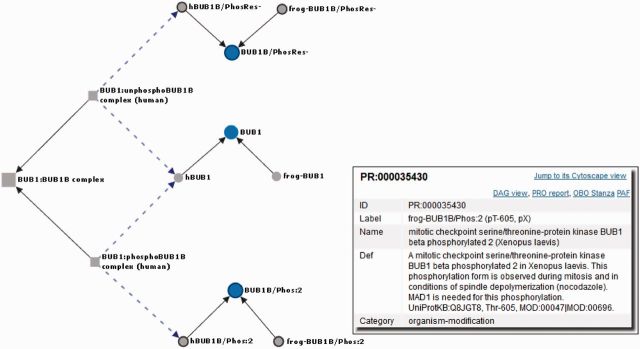
Cytoscape view of BUB1:BUB1B complexes. The is_a relationship between child and parent in the PRO hierarchy and the has_component relationship between complexes and their components are shown by black arrows and blue dotted arrows, respectively. Clicking on a node (e.g. frog-BUB1B/Phos:2) brings a pop-up box that provides details and allows additional actions. Only a subset of nodes is shown, which have been rearranged for clarity.