
Figure 2.
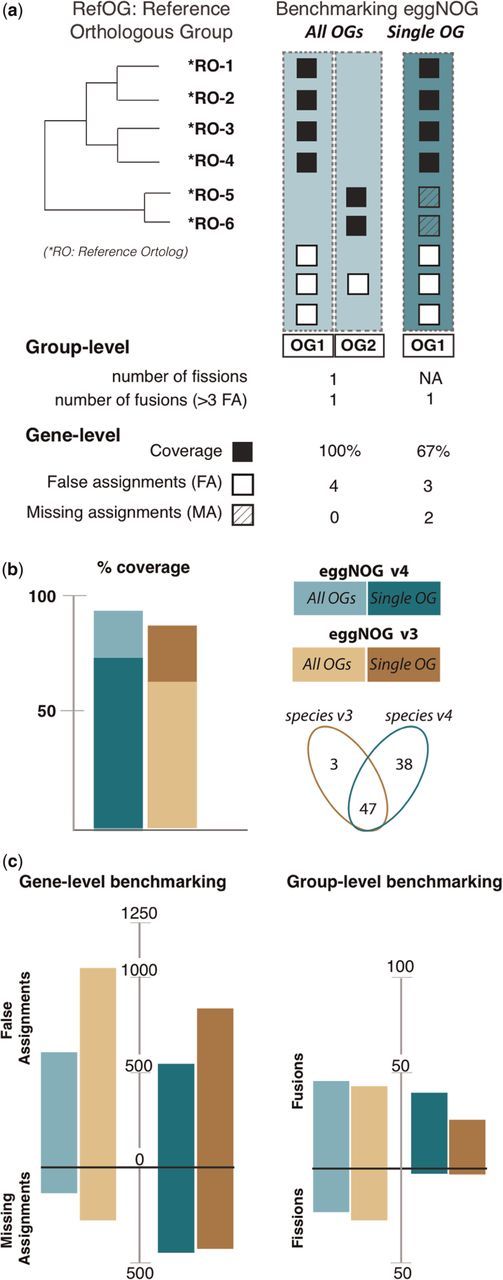
Benchmarking and comparing eggNOGv4 and eggNOGv3. (A) The performance of eggNOG database was evaluated at two levels: gene (identifying false and missing assignments) and group (identifying fusions and fissions) level using the Reference Orthologous Groups (RefOGs). Initially, we mapped the reference orthologs to the bilaterian-specific orthologous groups (biNOGs). We score eggNOG performance using (i) all orthologous groups (‘All OGs’) to identify the number of fissions and fusions for every RefOG and (ii) the orthologous group with the larger overlap with RefOG (‘Single OG’, i.e. OG1). Then, we calculated how many genes were predicted accurately (true assignments, TA, black box), how many genes were not predicted as orthologs (missing assignments, MA, striped white box) and how many genes were erroneous orthology predictions (false assignments, FA, white box). Depending on whether the user wants to evaluate the database on a ‘Single OG’ or ‘All OGs’ manner, it will change the numbers of true, missing and false assignments. (B) Comparison of the two most recent eggNOG versions (v3 and v4) in terms of %RefOG coverage (number of true assignments per total number of reference orthologs). Venn diagram shows the species number between the two database releases; there are 47 overlapping species that included the 12 animals that are used in the benchmarking data set. (C) Comparison of eggNOGv3 and eggNOGv4 at the gene level (false and missing assignments). The larger bars indicate a larger number of errors. (D) Comparison of eggNOGv3 and eggNOGv4 at the group level (fusion and fission events). The larger bars indicate a larger number of errors.