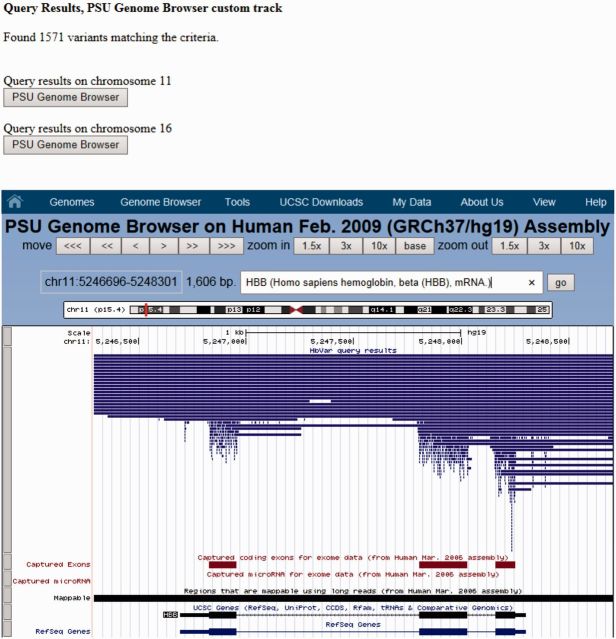
Figure 2.
Overview of the new HbVar visual display feature that couples with the PSU Genome Browser. A user can select a particular gene or genomic region in the human α- or β-globin cluster in the HbVar query page (HBB in this example) and the query returns all genomic variants (base changes, small indels and gross deletions) documented in HbVar that are present within the selected region. Note that the majority of single base changes are nicely clustered within the HBB gene exons. Similar displays can be obtained by using the UCSC Genome Browser using the HbVar custom tracks (not shown). The PSU Genome Browser toolbar is shown on top.

