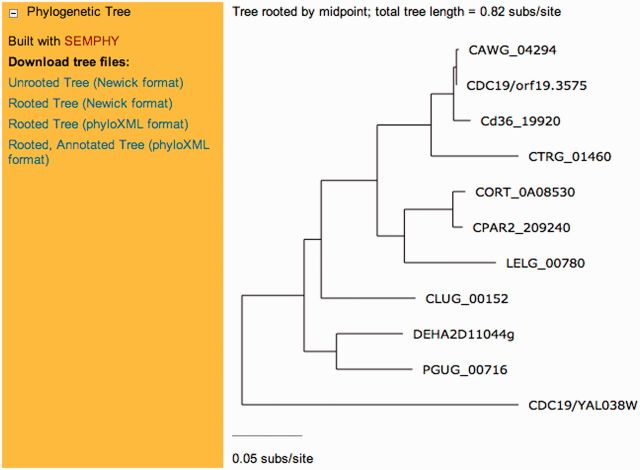
Figure 2.
Phylogenetic Tree Display on the CGD Homology Information tab. The phylogenetic trees are computed from the protein multiple sequence alignment for each ortholog cluster, using the SEMPHY program (29). The species name is displayed in a hover box when the cursor is placed above the gene name, and the full species and gene names are also listed directly above the tree in the Ortholog Cluster section of the page. This section of the Homology Information page may be hidden or expanded using the small plus-or-minus glyph located to the left of the header in the gold-colored sidebar.

