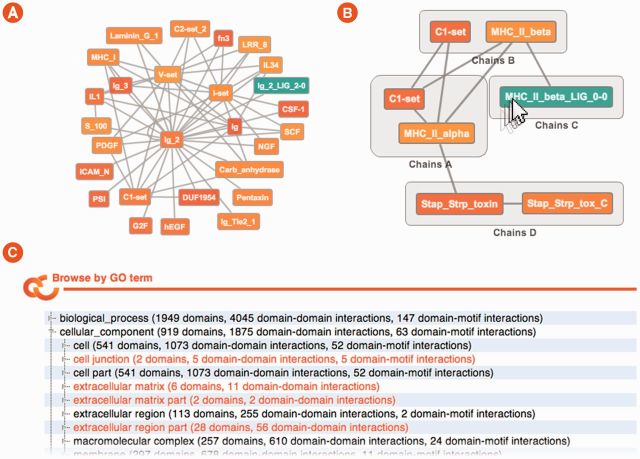
Figure 4.
Browsing 3did. (A) Interactive view of the DDI and DMI network involving a particular domain. In orange are the domains while the motifs are in green. By clicking on any node or edge you are redirected to the page showing details about the corresponding domain, motif or interaction. (B) Interactive view of the domains and motifs in a PDB file. It shows the domain composition of the different chains (clustered on identical domain composition) as well as the motifs present in the chains. Lines connect domains and motifs that are interacting. Both nodes and lines can be clicked in order to visualize the details of the corresponding domain, motif or interaction. The CytoscapeWeb-based network visualizations (A and B) require a Flash plug-in to be installed in the browser to run. (C) Browse by GO term. A new tree view in the ‘Browse’ page allows searching for all the domains that are annotated with a specific GO-term.

