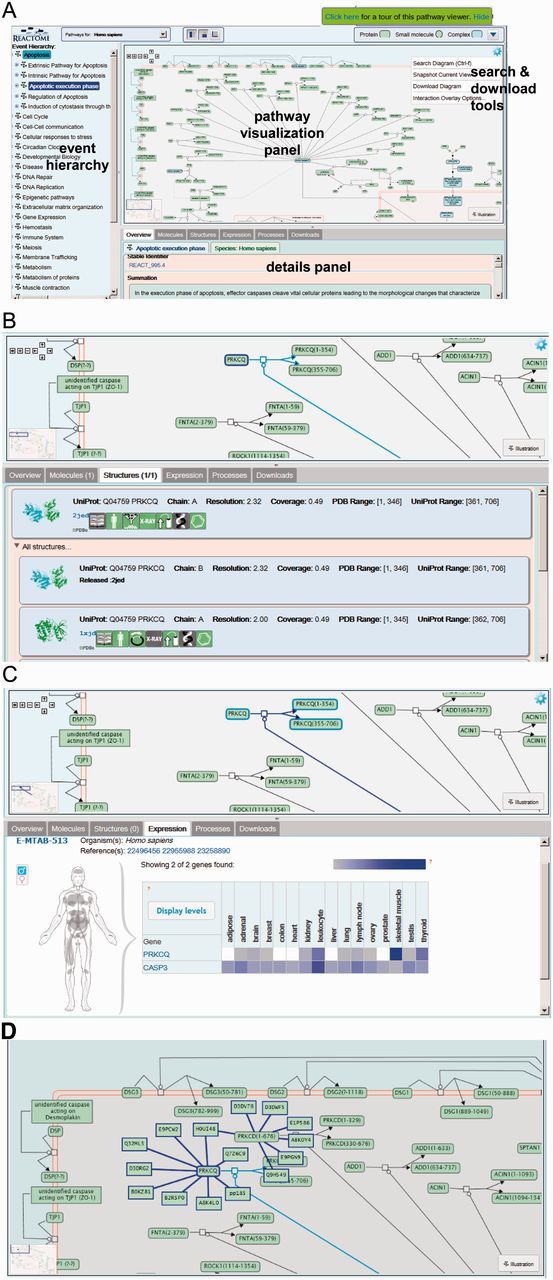
Figure 2.

Visualization of the execution phase of apoptosis. (A) Choosing the entry for this event from the event hierarchy in the left panel of the web page causes the pathway to be displayed in a large panel to the right, laid out in SBGN process description format. Buttons at the top of the panel open a diagram key and give access to a brief tour of features of the web page. The panel at the bottom of the page contains text descriptions of various features of the pathway and participating molecules, linked to external databases. (B) The user has selected the reaction ‘Caspase 3-mediated cleavage of PKC delta’; the ‘Structures’ detail tab displays PDB 3D structural data and citations for proteins in that reaction and the ‘Expression’ detail tab (C) displays condition-specific gene expression data from the Gene Expression Atlas. (D) The molecular interaction (MI) overlay displays proteins that interact with user-specified proteins PRKCQ and PRKCD.
