
Figure 2.
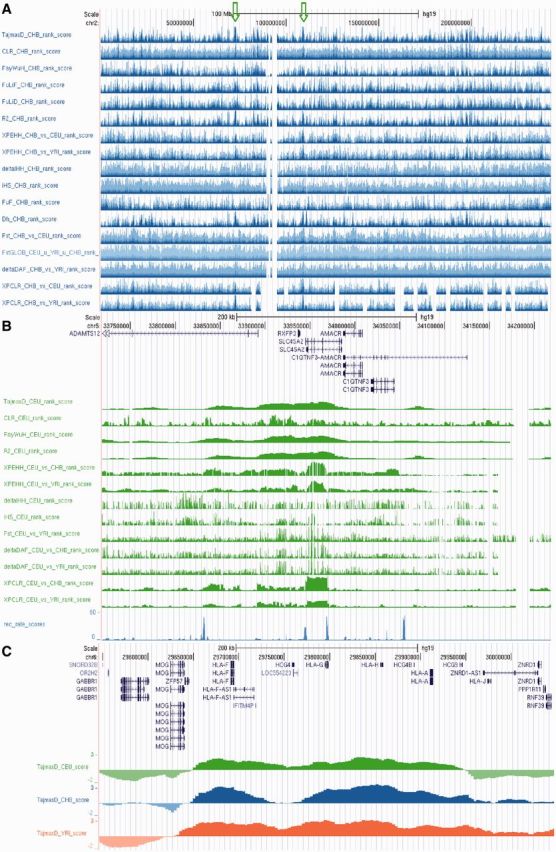
Examples of genomic regions under selection in the 1000 genomes selection browser. Tracks of statistics from different populations are visualized in colour (CEU in green, CHB in red and YRI in blue). Additional examples are given at http://hsb.upf.edu (A) The p- and q-arms of chromosome 2 (−log10 of empirically ranked scores). Recurrent peaks at around 72.5 Mb (left green arrow) and 109.5 Mb (right green arrow) indicate the loci CYP26B1/EXOC6B and EDAR, respectively. (B) Signature of positive selection around SLC45A2, another established skin colour gene, in the CEU population (0.5-Mb window; −log10 of empirically ranked scores). (C) Widespread balancing selection in the HLA region indicated by strongly positive scores for Tajima’s D in all three analysed human populations (0.5-Mb window).