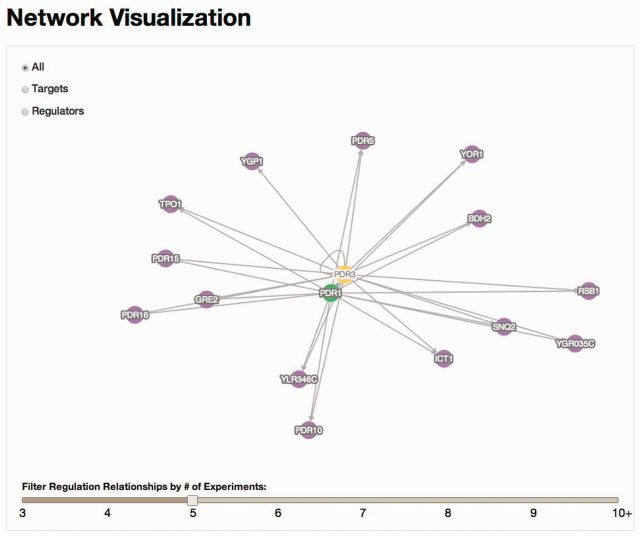
Figure 3.
Network visualization for an example gene, PDR3, showing regulatory relationships supported by five or more annotations. The network is drawn using Cytoscape.js (http://cytoscape.github.io/cytoscape.js/; (24)]. Users can zoom in and out of the network view using a trackpad or mouse wheel and reposition genes by dragging. Genes depicted in the graphic are color coded by their relationships with the central gene: regulators are green, whereas targets are purple. Radio buttons in the top left corner allow display of only targets or only regulators, and the adjustable slider at the bottom sets the minimum number of annotations supporting the relationships shown. To present meaningful networks, we limit each to no >100 genes and no >250 regulatory relationships. A network visualization does not appear for genes whose regulatory relationship data do not meet these criteria: for example, a gene that has >250 regulatory relationships, each supported by just one annotation.

