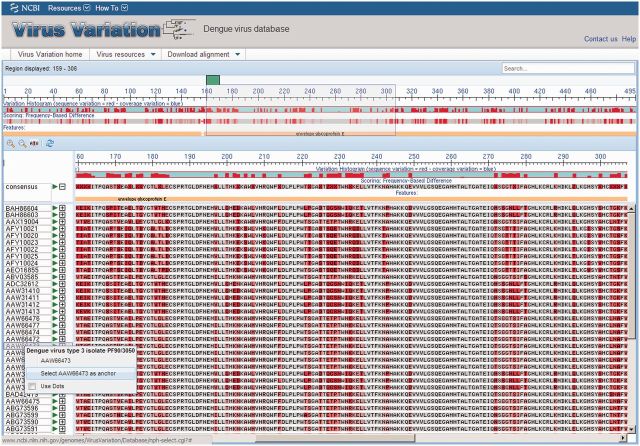
Figure 3.
Virus Variation multi-sequence alignment viewer. The results from a DENV database query were aligned and displayed in the Virus Variation multi-sequence alignment viewer. The top section of the alignment viewer includes a histogram that displays sequence and coverage variation across the alignment, a second histogram that plots the frequency of sequence differences with a shading scheme and highlights insertions and deletions with gaps and a feature table where protein names and other sequence feature identifiers are displayed. The alignment position is indicated above the histogram, and the region displayed in the lower section is highlighted by a gray box. The lower section displays the highlighted region in greater detail by default, but the magnification can be decreased or increased as desired by the user. Alignments are anchored to the consensus sequence by default, but any sequence can be selected as an anchor. Sequences identical to the consensus can be displayed as individual nucleotides or amino acids or replaced with dots—highlighting variations from the consensus.

