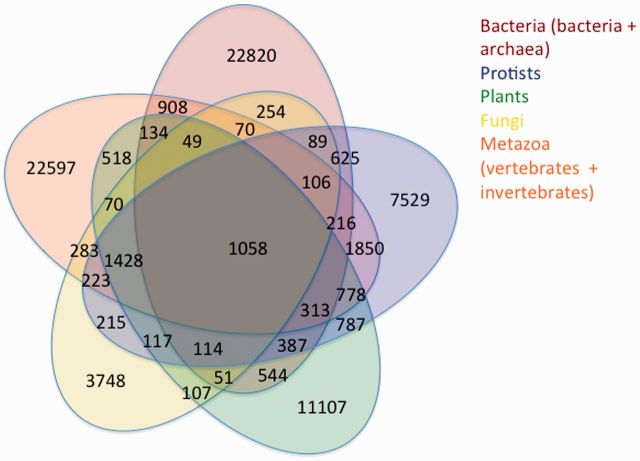
Figure 2.
Taxonomic distribution of gene families in the pan-taxonomic comparative analysis in release 19 of Ensembl Genomes. Large numbers of families [defined by clustering according to the Ensembl Gene Trees algorithm (27)] are found only in one domain of life. However, families can be found spanning all combination of domains. The most overrepresented spans (compared with expectations based on the same proportion of families being covering each domain, but assuming the co-coverage of two domains is random) are (i) all five domains and (ii) all four non-bacterial domains; the most underrepresented spans are (i) bacteria and metazoa and (ii) bacteria, metazoa and fungi. For each family of related proteins, a gene tree is constructed and made available for visualization and download, estimating the evolutionary history of that family.

