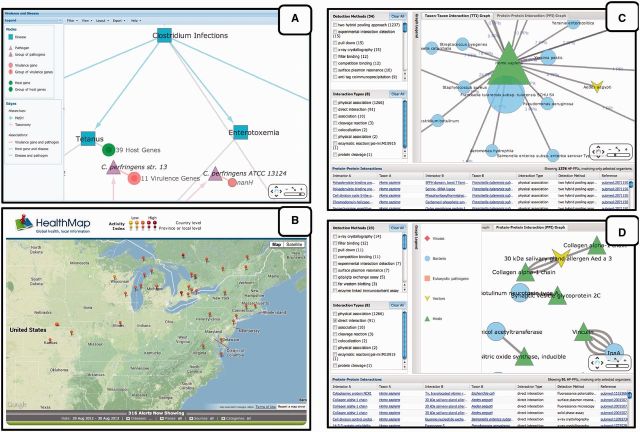
Figure 3.
Data integration tools. PATRIC’s Disease View provides an interactive graph (A) that summarizes relationships between pathogens, the diseases they cause, and both host and pathogen genes associated with that disease. A collaboration with HealthMap that provides a global summary of geolocation reports showing disease-related information in real-time is also provided (B). The Protein Interaction Gateway collects data from public databases and allows researchers to examine data summarized at the taxon level (C), and also to look at individual PPIs with a sortable grid and node-edged graphs (D).

