
Figure 2.
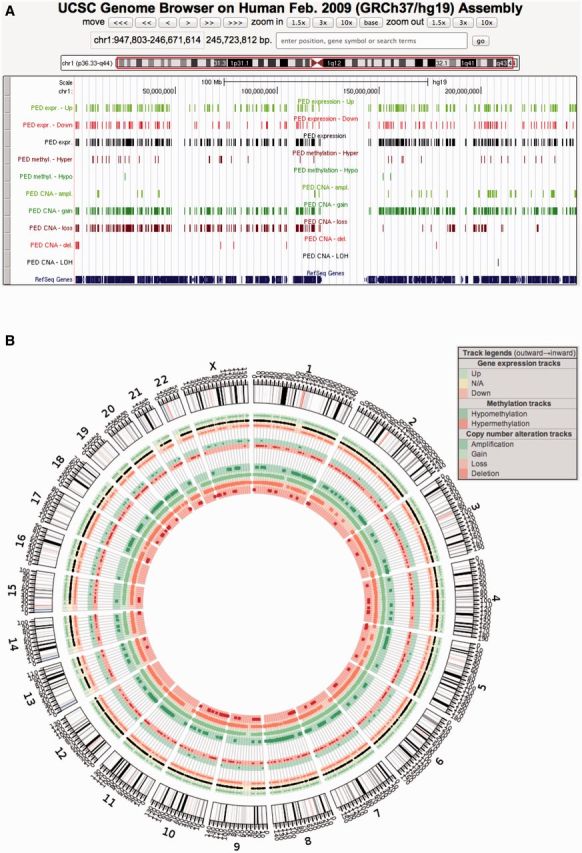
Integrated graphical view of transcriptomic and genomic changes observed between pancreatic ductal adenocarcinoma and normal tissue samples. This query starts by choosing the ‘Pancreatic Expression Database’ from the ‘Choose Database’ from the drop-down selection in the right panel. A ‘Choose Dataset’ drop-down selection menu will automatically appear. In this example, users will choose ‘Pancreatic Gene Expression’ data set. The next step involves choosing the appropriate filters to restrict the query in this first data set by clicking on the ‘Filters’ node on the left, expanding the filter section ‘EXPERIMENT:’, selecting ‘PDAC study—tissue’ and ‘Pancreatic ductal adenocarcinoma (PDAC)/Normal pancreas (NP)’. The overlapping CNAs are added as a second data set by clicking on the second ‘Dataset’ from the bottom of the left panel and choosing ‘Pancreatic Copy Number Alteration’ from the ‘Choose additional dataset’ drop down menu that will appear in the right panel. Clicking the ‘Results’ button on the left side of the toolbar will retrieve a result table. To generate the graphical view of the results, simply hit the UCSC or CIRCOS buttons on the right side of the toolbar. (A) Single chromosome (chr 1) view in UCSC Genome Browser. (B) Whole-genome view in CIRCOS viewer.