
Figure 1.
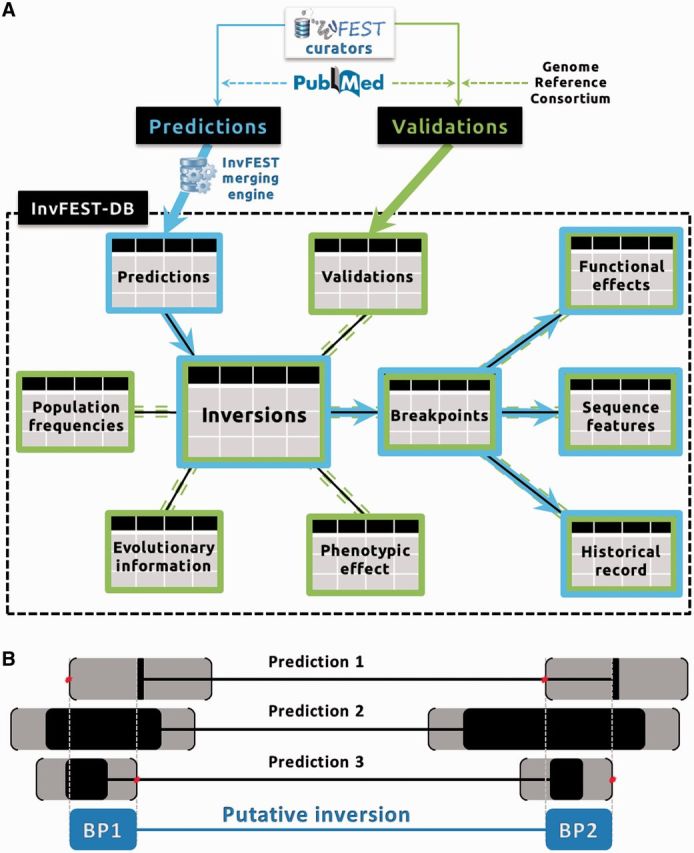
(A) Diagram of the InvFEST data model and processing. The dotted box shows a simplified star-like schema of the InvFEST database. The information processed by the automatic InvFEST merging engine is shown in blue and connected by arrows, while the process of manual addition of validations and other data is shown in green and connected by dashed lines. (B) Automatic definition of inversion breakpoints through the InvFEST merging engine. Assigned breakpoints correspond to the overlap between the breakpoints of all individual predictions, always taking into account the resolution of each study methodology (shown in grey).