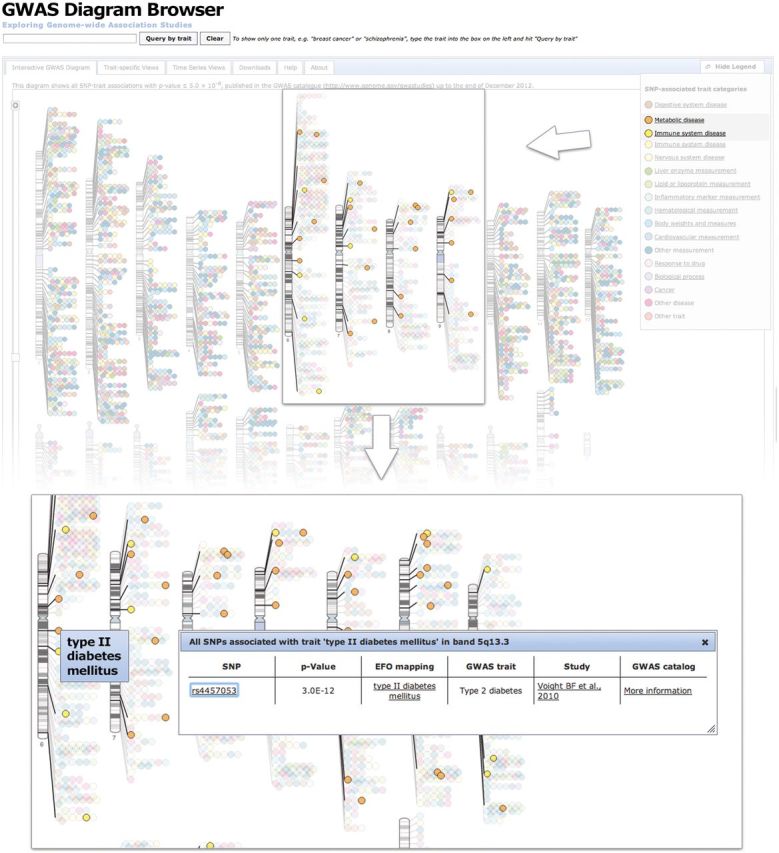
Figure 2.

The interactive GWAS diagram is a visualization of all SNP-trait associations with P <5 × 10⁻⁸, mapped to the SNP's cytogenetic band. Visualizations of SNPs with metabolic or immune system disease are highlighted. Hovering over a SNP displays the trait name; clicking on it returns the individual SNP-trait associations, including P-value and publication, as well as links to the relevant entry in the GWAS Catalog, Europe PMC and Ensembl.
