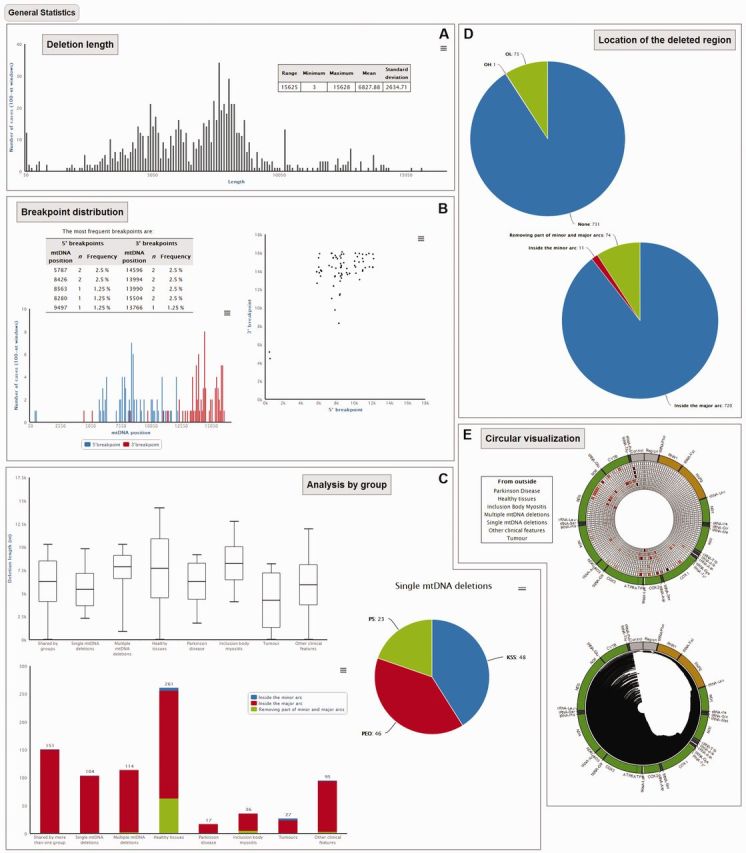
Figure 3.

The general statistics section of MitoBreak for a dataset with mtDNA deletions. This section provides a series of descriptive analyses such as (A) deletion lengths, (B) breakpoint distributions, (C) analysis by group, (D) locations of the deleted regions and (E) mtDNA circular visualization. The button opening each analysis is shown in grey.
