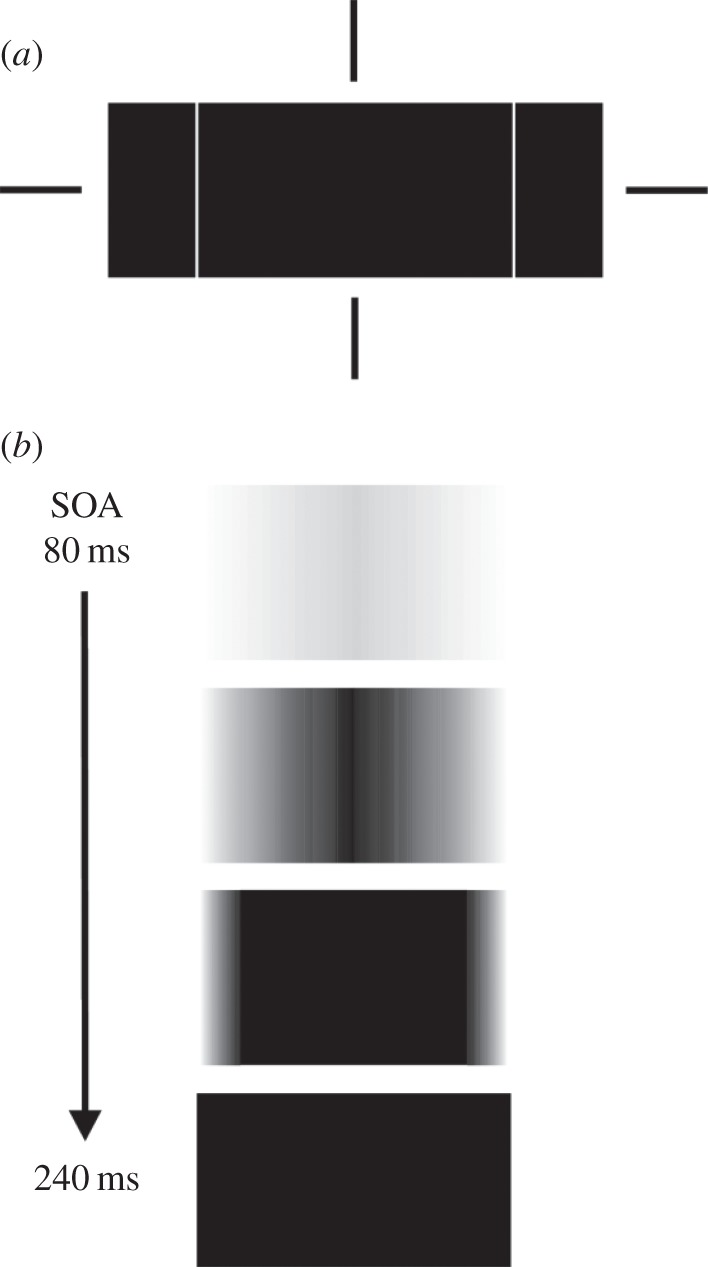
Figure 3.

(a) Schematic of target rectangle and the two flanking mask rectangles centred at the notional fixation cross depicted by the vertically and horizontally collinear bars. (b) The appearance of the target at target-mask onset asynchronies (SOAs) increasing from 80 to 240 ms. Adapted from Breitmeyer & Jacob [63].
