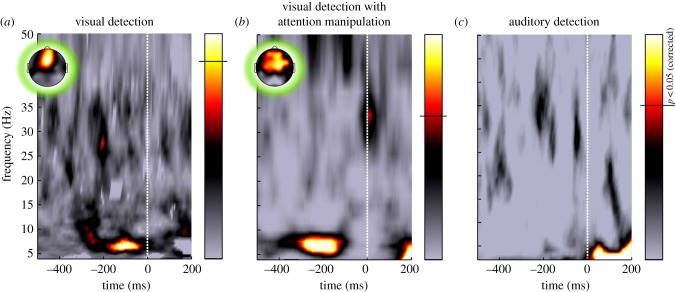
Figure 1.
Pre-stimulus EEG signatures of visual, but not auditory perceptual cycles. The time–frequency maps represent the significance of ‘phase opposition’ between target-perceived and target-unperceived trials. This measure is determined by comparing the average phase-locking (or intertrial coherence, ITC) of each trial group with surrogate phase-locking values obtained over trial groups of the same size but randomly drawn among perceived and unperceived trials. A significant phase opposition at a particular time and frequency indicates that perceived and unperceived trials are associated with different phase values. (a) A pre-stimulus phase opposition was found at approximately 7 Hz in a visual experiment where subjects (n = 12) were free to attend to the target location (which was known in advance). The inset on the top-left represents the scalp topography of the pre-stimulus phase-opposition at this frequency, with a maximum around frontocentral electrodes. (b) The same result was replicated in a visual experiment with explicit attentional manipulation, but only for targets appearing on the attended side (n = 13). (c) However, no pre-stimulus phase opposition was found in an auditory experiment in which subjects (n = 21) were required to detect auditory clicks in a silent background. (No scalp topography is shown here as there were no significant pre-stimulus time–frequency points). (Online version in colour.)

