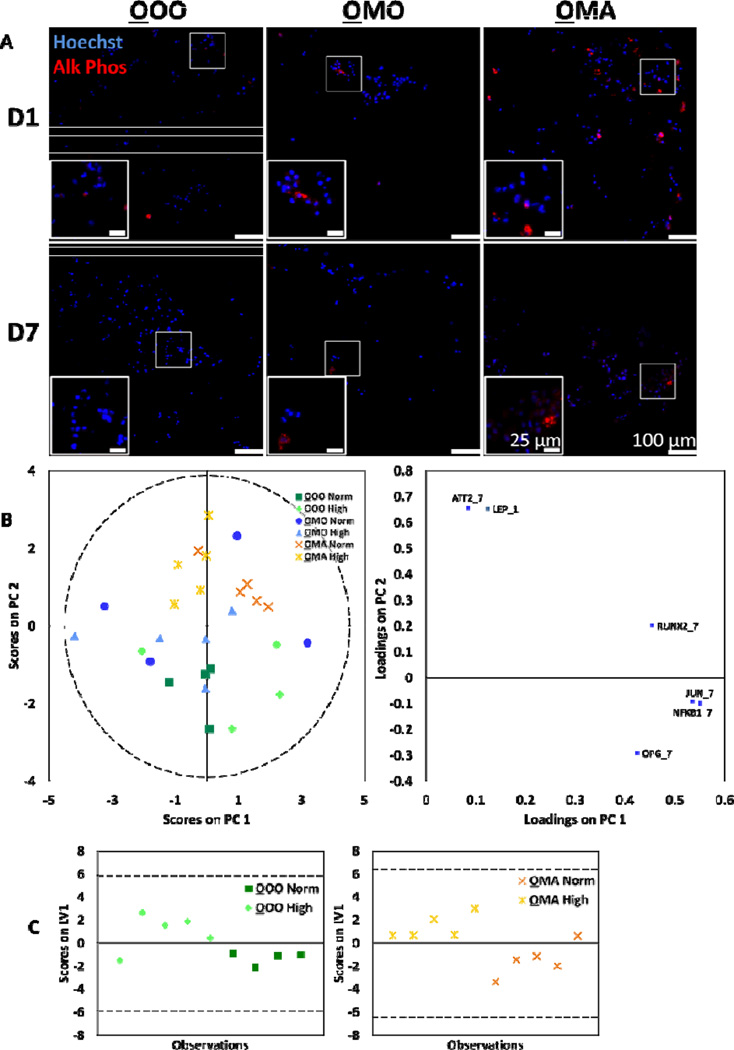
Fig. 4.
Osteoblasts were assessed for response to culture conditions. (A) Representative images of osteoblasts stained for ALP, a marker of osteogenic differentiation (red), and counterstained with Hoechst for nuclei (blue). Noticeably higher amount of ALP production was seen in osteoblasts from OMA cultures at day 1. (B) PCA was applied to the gene expression data of the global osteoblast population, yielding two principal components (R2X= 0.81 and Q2= 0.56). (C) For OOO and OMA cultures, classes based on normal and high glucose levels were discriminated using PLS-DA (OOO: R2Y= 0.5 and Q2= 0.43; OMA: R2Y=0.62 and Q2= 0.55). The corresponding weight plots can be found in the supplementary information (Fig. S3B). In all models, dashed lines represent the 95% confidence limit of the distribution of scores.

