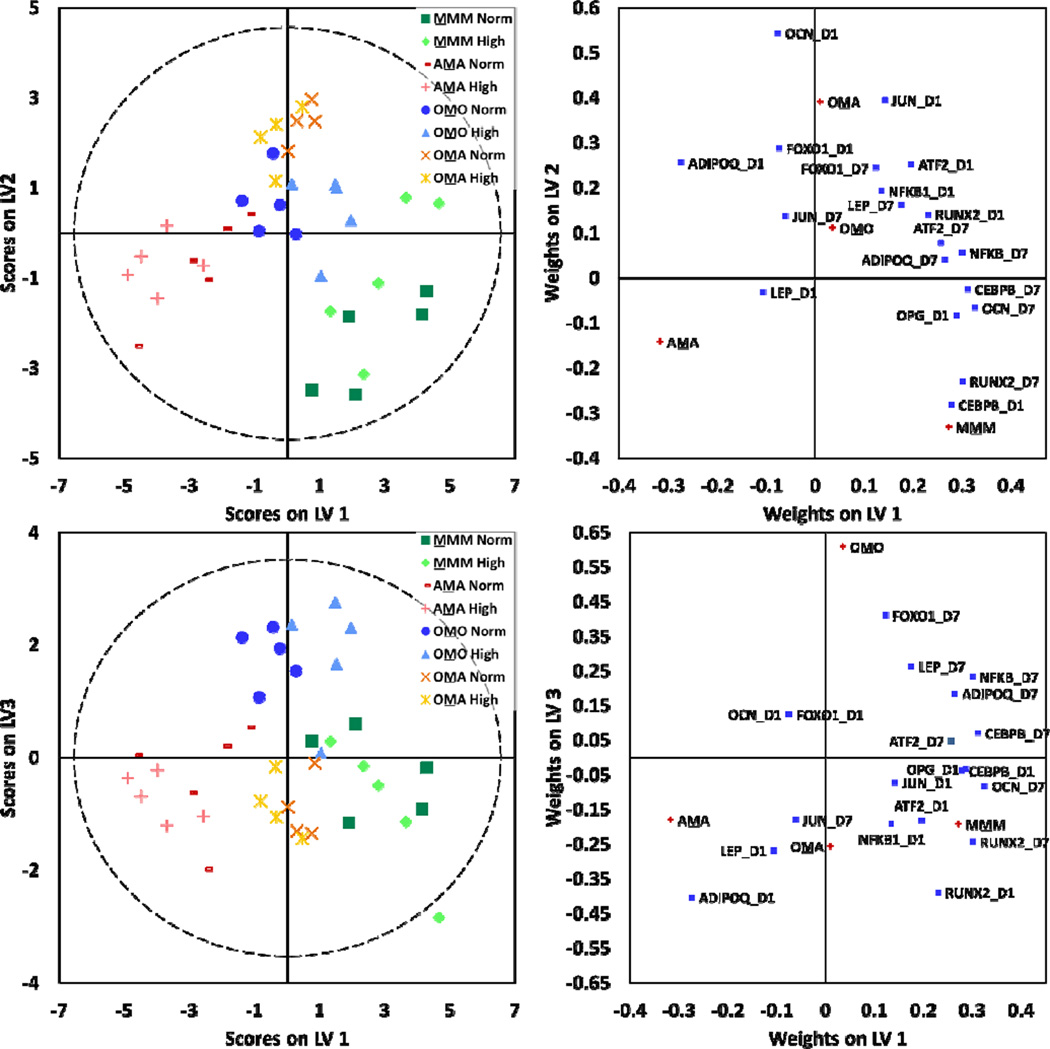
Fig. 6.
MSCs were assessed for gene expression changes response to culture conditions. PLS-DA models were constructed for MSCs assigned to classes by culture configuration. Models yielded three latent variables that discriminated MSCs by culture configuration (R2Y=0.73 and Q2= 0.63). In all models, dashed lines represent the 95% confidence limit of the distribution of weights.

