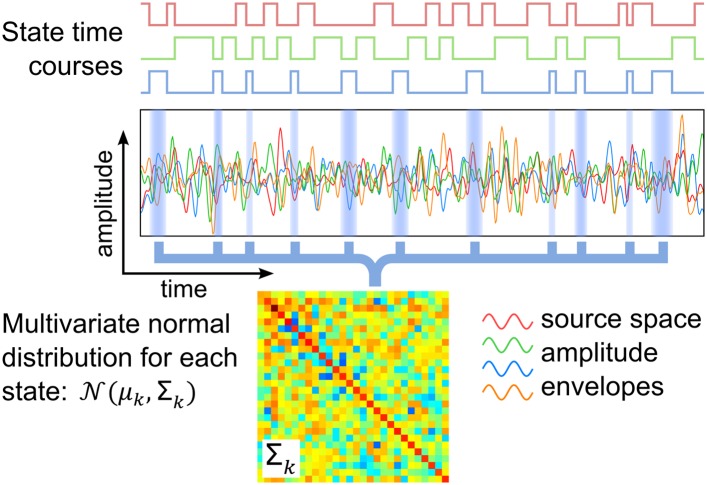
Figure 1. Schematic of the HMM outputs.
An HMM with K states is inferred from band-limited amplitude envelopes of source reconstructed MEG data. Each state is characterized by a multivariate normal distribution (defined by means μk and covariance matrix Σk) and a state time course, which is a binary sequence that indicates the points in time at which the state is active.

