. 2014 Mar 25;3:e01867. doi: 10.7554/eLife.01867

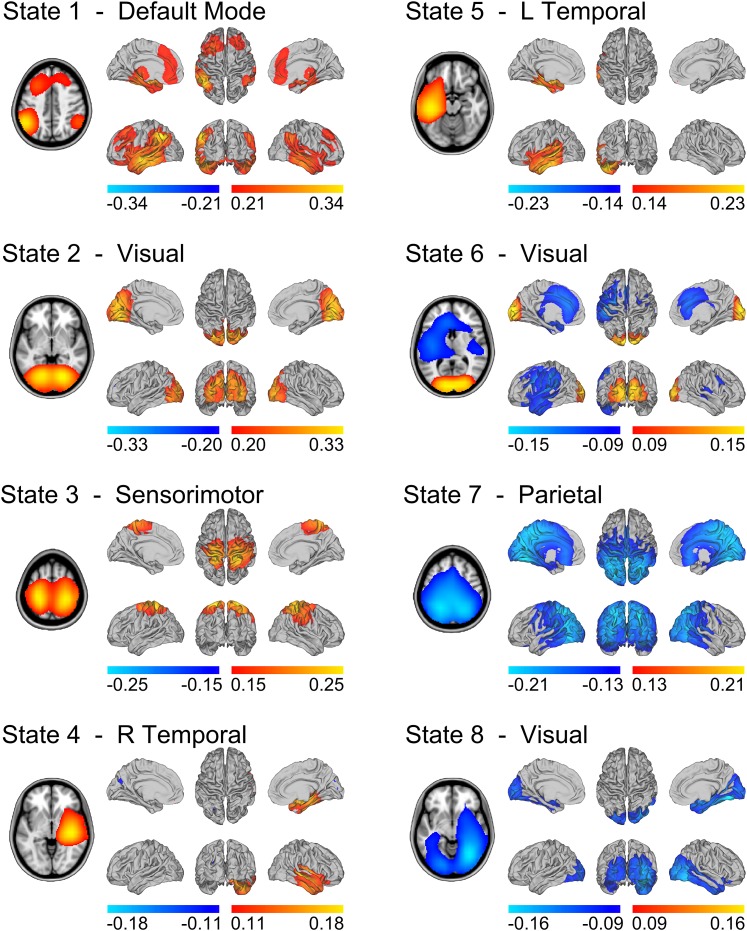
Figure 2. State specific changes in band-limited amplitude.

An 8 state HMM was inferred from temporally concatenated band-limited amplitude time courses (concatenated over nine subjects, 10 min each). The volumes and surface renderings show the partial correlation of each state time course with the envelope data at each voxel. The correlation values have been thresholded between 60% and 100% of the maximum correlation for each state and the color maps represent these ranges. Red/yellow and blue colors indicate positive and negative correlations respectively. See also Figure 2—figure supplement 1 for equivalent results from HMMs inferred with 4–14 states.

DOI: http://dx.doi.org/10.7554/eLife.01867.004

Figure 2.

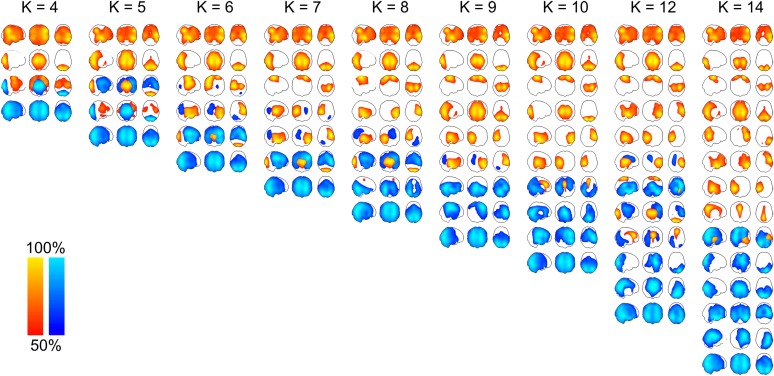
Figure 2—figure supplement 1. Maximum intensity projection maps showing the partial correlation computed between each state time course and the envelope data for a k state HMM for k = 4 to k = 14.

Figure 2—figure supplement 1.

Increasing the number of states did not change the topographies of the most prominent RSN-like states nor did it reveal any new RSN-like topographies that were distinct from those inferred with 8 states, but rather resulted in the splitting of states into multiple similar maps. This suggests that there is no advantage to using more than 8 states for the purpose of identifying states corresponding to known RSNs. In fact, it could be argued that fewer than 8 states are required for this purpose.
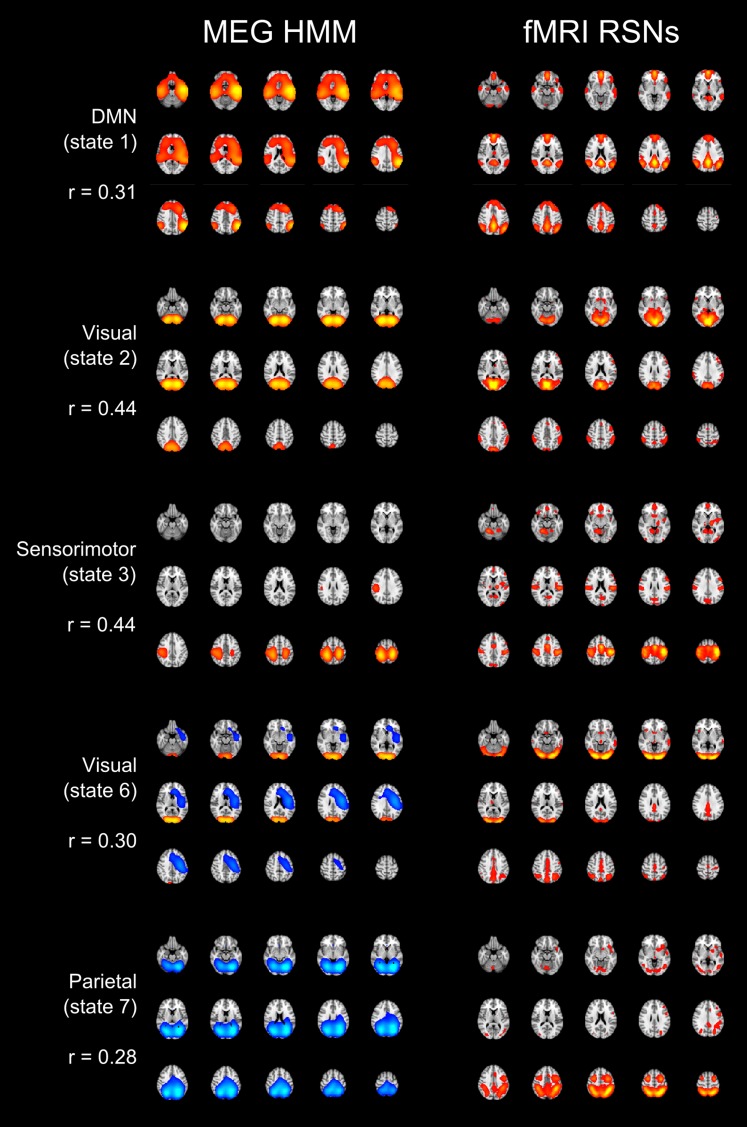
Figure 2—figure supplement 2. Spatial maps of five of the inferred states alongside a matched RSN derived from application of spatial ICA to resting state fMRI data (Smith et al., 2009).

Figure 2—figure supplement 2.

For each HMM–RSN pair, the spatial correlation is shown alongside the maps.