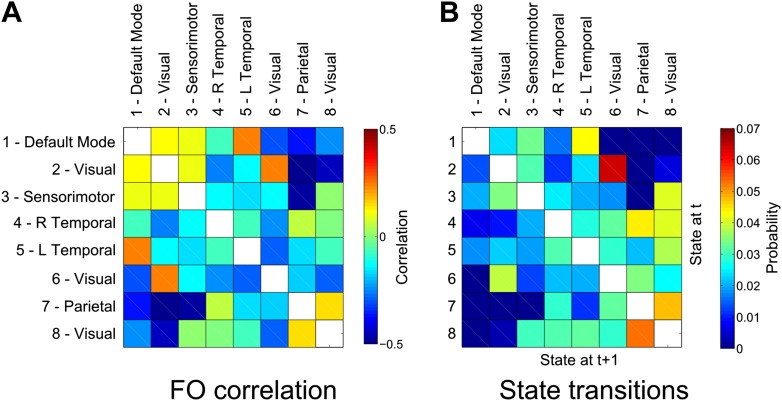
Figure 5. Relationship between states.
(A) Correlation matrix between the fractional occupancy time courses of each state. Positive correlations between a pair of states indicate that the two states are visited more frequently during similar periods of time. (B) State transition matrix for the group HMM. The matrix shows the probabilities of transitioning to any particular state given the current state. The probability of remaining in the same state has been excluded from each matrix (shown in white).

