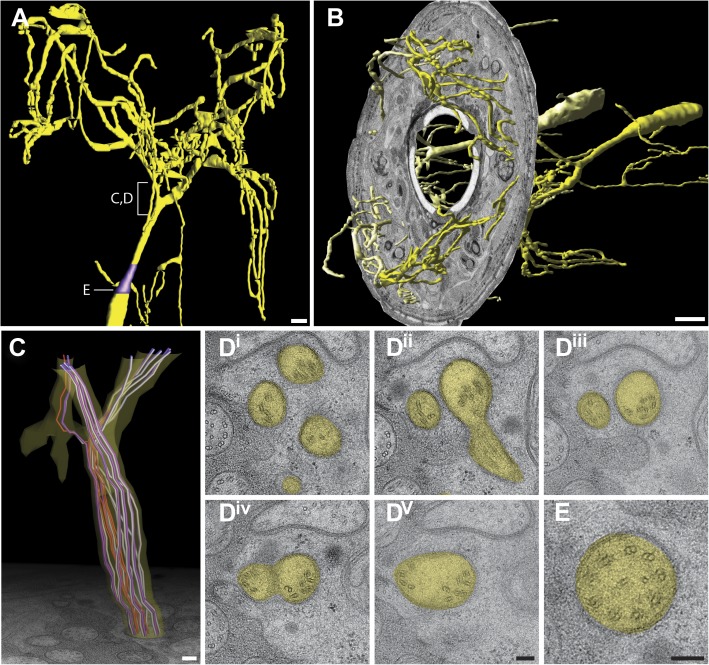
Figure 10. Ultrastructure of the AWA cilium.
(A) 3D reconstruction model of an AWA cilium, indicating TZ (purple). Scale bar: 1 μm. (B) 3D reconstruction model of AWA cilia with a single cross-sectional view indicating the spread of AWA ciliary branches from the lateral/amphid lips to adjacent dorsal and ventral lips. Anterior at left. Scale bar: 1 μm. (C) Model of MTs in the region indicated in (A). Dark purple—A tubules; light purple—B tubules; red—isMTs. Anterior at top. (Di–v) Cross-section TEM series showing MT distribution upon branching from distal (Di) to proximal (Dv). (E) Cross-section TEM of an organized AWA TZ. Scale bar 100 nm.

